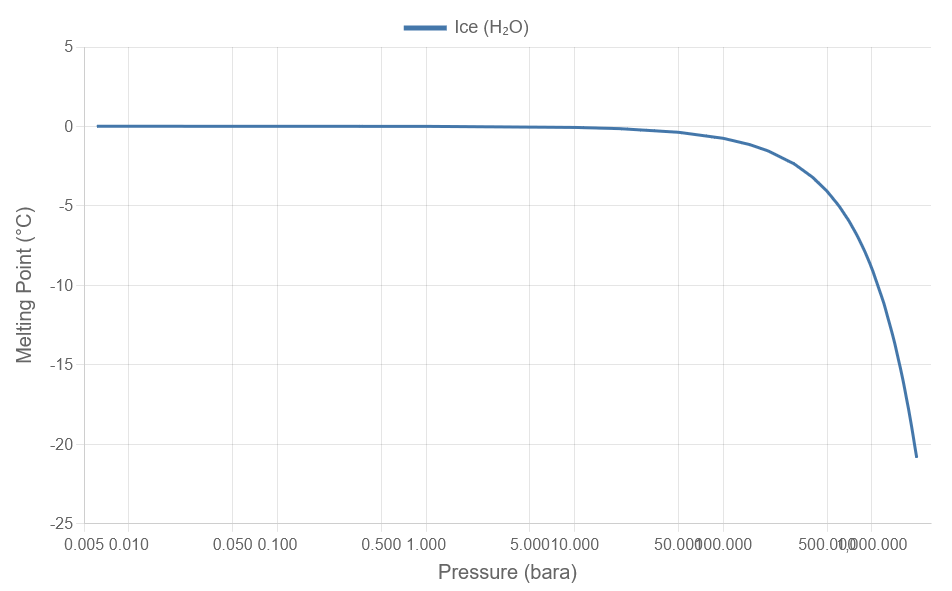
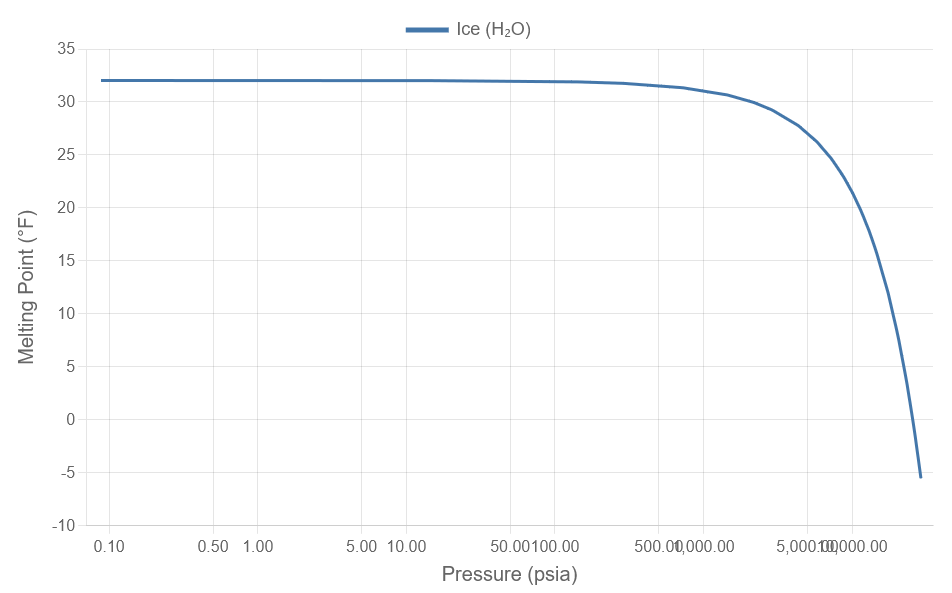
The melting point is the temperature at which a solid transitions to a liquid. For water, the melting point of ordinary ice (Ice Ih) at standard atmospheric pressure (1 atm = 1.01325 bara) is defined as 0 °C (32 °F). The data on this page covers pressures from near the water triple point (0.00612 bara, 0.01 °C) up to 2,000 bara (approximately 29,000 psia, −20.8 °C).
Water is one of the few substances where the solid phase is less dense than the liquid phase — ice floats on water. As a consequence, increasing pressure lowers the melting point, the opposite of most other materials. This behavior is governed by the Clausius–Clapeyron equation for solid–liquid equilibrium:
For ice Ih, the molar volume change ΔV is negative (ice is less dense than water at 0 °C), so dT/dP is negative — the melting temperature decreases as pressure increases. Near standard conditions, the slope is approximately −0.0075 °C per atmosphere. By 2,000 bara the melting point has dropped to about −20.8 °C (−5.5 °F).
The pressure dependence of the ice melting point is relevant in several engineering and scientific contexts. Deep-ice drilling operations, glaciology models, and high-pressure food processing (high-pressure freezing) all rely on the shift in melting point with pressure. In water pipeline systems, localized high-pressure zones can theoretically suppress ice formation even at sub-zero temperatures. Ice skating also exploits this phenomenon on a small scale, although the dominant mechanism there is frictional heating rather than pressure melting.
Note that at pressures above approximately 2,100 bara (210 MPa), water transitions to different ice polymorphs (Ice III, Ice V, Ice VI, and beyond), each exhibiting distinct melting behavior. The data presented here applies only to ordinary Ice Ih, which is the phase relevant to nearly all engineering applications.