The AISI or SAE alloy steels contain, in addition to carbon, up to about 1 percent (up to 0.5 percent for most airframe applications) additions of various alloying elements to improve their strength, depth of hardening, toughness, or other properties of interest. Generally, alloy steels have better strength-to-weight ratios than carbon steels and are somewhat higher in cost on a weight, but not necessarily strength, basis. Their applications in airframes include landing-gear components, shafts, gears, and other parts requiring high strength, through hardening, or toughness.
Some alloy steels are identified by the AISI four-digit system of numbers. The first two digits indicate the alloy group and the last two the approximate carbon content in hundredths of a percent. The alloying elements used in these steels include manganese, silicon, nickel, chromium, molybdenum, vanadium, and boron. Other steels in this section are proprietary steels which may be modifications of the AISI grades. The alloying additions in these steels may provide deeper hardening, higher strength and toughness.
These steels are available in a variety of finish conditions, ranging from hot- or cold-rolled to quenched-and-tempered. They are generally heat treated before use to develop the desired properties. Some steels in this group are carburized, then heat treated to produce a combination of high surface hardness and good core toughness.
Forging: The alloy steels are only slightly more difficult to forge than carbon steels. However, maximum recommended forging temperatures are generally about 50°F lower than for carbon steels of the same carbon content. Slower heating rates, shorter soaking period, and slower cooling rates are also required for alloy steels.
Cold Forming: The alloy steels are usually formed in the annealed condition. Their formability depends mainly on the carbon content and is generally slightly poorer than for unalloyed steels of the same carbon content. Little cold forming is done on these steels in the heat-treated condition because of their high strength and limited ductility.
Machining: The alloy steels are generally harder than unalloyed steels of the same carbon content. As a consequence, the low-carbon alloy steels are somewhat easier to finish machine than their counterparts in the carbon steels. It is usually desirable to finish machine the carburizing and through-hardening grades in the final heat-treated condition for better dimensional accuracy. This often leads to two steps in machining: rough machining in the annealed or hot-finished condition, then finish machining after heat treating. The latter operation, because of the relatively high hardness of the material, necessitates the use of sharp, well-designed, high-speed steel cutting tools, proper feeds, speeds, and a generous supply of coolant. Medium- and high-carbon grades are usually spheroidized for optimum machinability and, after heat treatment, may be finished by grinding. Many of the alloy steels are available with added sulfur or lead for improved machinability. However, resulfurized and leaded steels are not recommended for highly stressed aircraft and missile parts, because of drastic reductions in transverse properties.
Welding: The low-carbon grades are readily welded or brazed by all techniques. Alloy welding rods comparable in strength to the base metal are used, and moderate preheating (200 to 600°F) is usually necessary. At higher carbon levels, higher preheating temperatures, and often postwelding stress relieving, are required. Certain alloy steels can be welded without loss of strength in the heat-affected zone provided that the welding heat input is carefully controlled. If the composition and strength level are such that the strength of the welded joint is reduced, the strength of the joint may be restored by heat treatment after welding.
Heat Treatment: For the low alloy steels, there are various heat treatment procedures that can be applied to a particular alloy to achieve any one of a number of specific mechanical (for example tensile) properties. Within this chapter, there are mechanical properties for three thermal processing conditions: annealed, normalized, and quenched and tempered. The specific details of these three thermal processing conditions are reviewed in Reference 2.3.0.2.5. In general, the annealed condition is achieved by heating to a suitable temperature and holding for a specified period of time. Annealing generally softens the material, producing the lowest mechanical properties. The normalized condition is achieved by holding to a slightly higher temperature than annealing, but for a shorter period of time. The quenched and tempered condition is used to produce the highest mechanical properties while providing relatively high toughness. The mechanical properties for these three processing conditions for specific steels are as shown in Tables 2.3.1.0(c), (f), and (g).
Maximum hardness in these steels is obtained in the as-quenched condition, but toughness and ductility in this condition are comparatively low. By means of tempering, their toughness is improved, usually accompanied by a decrease in strength and hardness. In general, tempering temperatures to achieve very high strength should be avoided when toughness is an important consideration.
In addition, these steels may be embrittled by tempering or by prolonged exposure under stress within the “blue brittle” range (approximately 500 to 700°F). Strength levels that necessitate tempering within this range should be avoided.
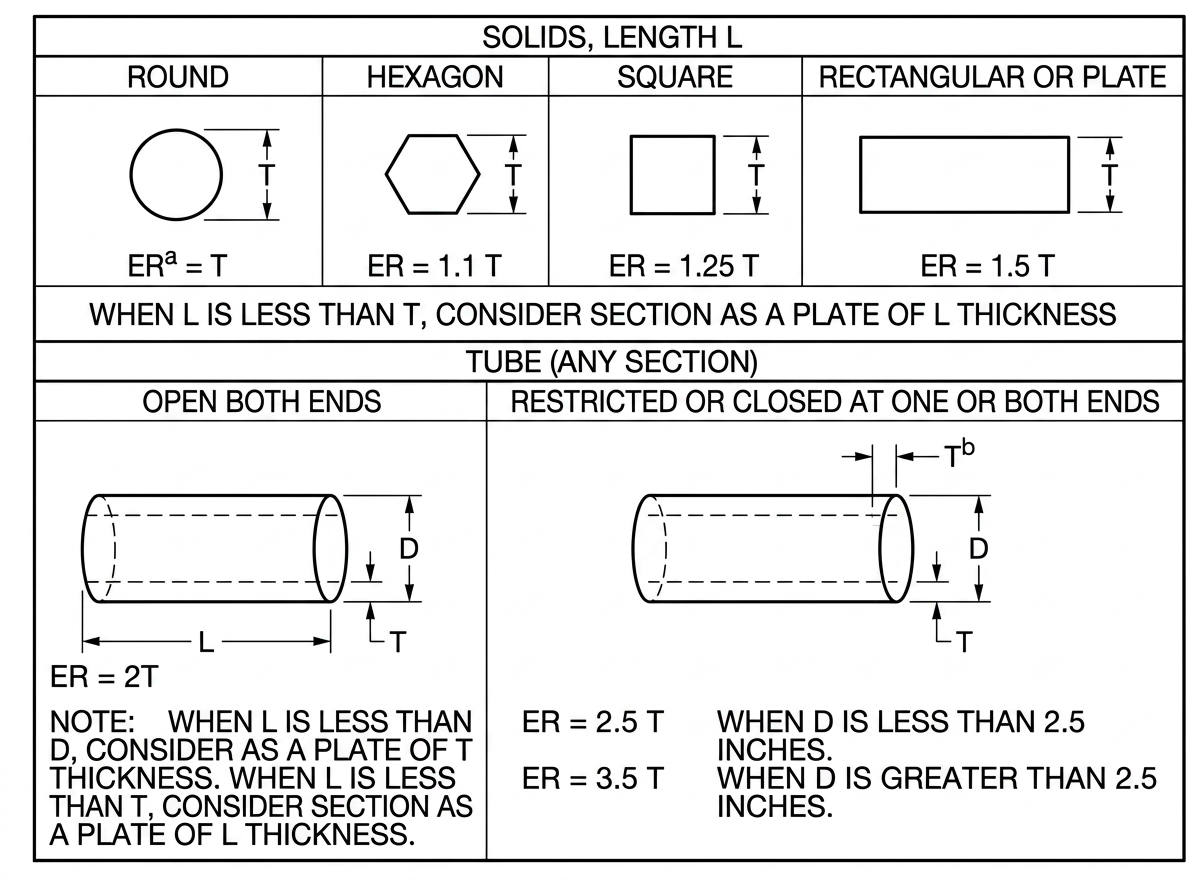
The mechanical properties presented in this chapter represent steels heat treated to produce a quenched structure containing 90 percent martensite at the center and tempered to the desired Ftu level. This degree of through hardening is necessary to insure the attainment of reasonably uniform mechanical properties throughout the cross section of the heat-treated part. The maximum diameter of round bars capable of being through hardened consistently are given in Table 2.3.0.2. Limiting dimensions for common shapes other than round are determined by means of the “equivalent round” concept in Figure 2.3.0.2.
For the quenched and tempered condition, a large range of mechanical property values can be achieved. Because of the potential for several different processing methods, the MIL, Federal, and AMS specifications do not always contain minimum mechanical property values (S-basis). Those specifications cited in this Handbook that do not contain mechanical properties are identified with a footnote in Tables 2.3.1.0(a) and (b).
| Ftu, ksi | Maximum Diameter of Round or Equivalent Round, in.a | ||||||
|---|---|---|---|---|---|---|---|
| 0.5 | 0.8 | 1.0 | 1.7 | 2.5 | 3.5 | 5.0 | |
| 270 & 280 | ··· | ··· | ··· | ··· | ··· | ··· | 300Mc |
| 260 | ··· | ··· | ··· | AISI 4340b | AISI 4340c | AISI 4340d | ··· |
| 220 | ··· | ··· | ··· | AMS Gradesb,e | AMS Gradesc,e | D6ACb | D6ACc |
| 200 | ··· | AISI 8740 | AISI 4140 | AISI 4340b AMS Gradesb,e |
AISI 4340c AMS Gradesc,e |
AISI 4340d | D6ACc |
| ≤180 | AISI 4130 and 8630 |
AISI 8735 4135 and 8740 |
AISI 4140 | AISI 4340b AMS Gradesb,e |
AISI 4340c AMS Gradesc,e |
AISI 4340d D6ACb |
D6ACc |
| a This table indicates the maximum diameters to which these steels may be through hardened consistently by quenching as indicated. Any steels in this table may be used at diameters less than those indicated. The use of steels at diameters greater than those indicated should be based on hardenability data for specific heats of steel. | |||||||
| b Quenched in molten salt at desired tempering temperature (“martempering”). | |||||||
| c Quenched in oil at a flow rate of 200 feet per minute. | |||||||
| d Quenched in water at a flow rate of 200 feet per minute. | |||||||
| e 4330V, 4335V, and Hy-Tuf. | |||||||
Alloy steels containing chromium or high percentages of silicon have somewhat better oxidation resistance than the carbon or other alloy steels. Elevated-temperature strength for the alloy steels is also higher than that of corresponding carbon steels. The mechanical properties of all alloy steels in the heat-treated condition are affected by extended exposure to temperatures near or above the temperature at which they were tempered. The limiting temperatures to which each alloy may be exposed for no longer than approximately 1 hour per inch of thickness or approximately one-half hour for thicknesses under one-half inch without a reduction in strength are listed in Table 2.3.0.3. These values are approximately 100°F below typical tempering temperatures used to achieve the designated strength levels.
| Ftu, ksi | Exposure Limit, °F | ||||||
|---|---|---|---|---|---|---|---|
| 125 | 150 | 180 | 200 | 220 | 260 | 270 & 280 | |
| Alloy: | |||||||
| AISI 4130 and 8630 | 925 | 775 | 575 | ··· | ··· | ··· | ··· |
| AISI 4140 and 8740 | 1025 | 875 | 725 | 625 | ··· | ··· | ··· |
| AISI 4340 | 1100 | 950 | 800 | 700 | ··· | 350 | ··· |
| AISI 4135 and 8735 | 975 | 825 | 675 | ··· | ··· | ··· | ··· |
| D6AC | 1150 | 1075 | 1000 | 950 | 900 | 500 | ··· |
| Hy-Tuf | 875 | 750 | 650 | 550 | 450 | ··· | ··· |
| 4330V | 925 | 850 | 775 | 700 | 500 | ··· | ··· |
| 4335V | 975 | 875 | 775 | 700 | 500 | ··· | ··· |
| 300M | ··· | ··· | ··· | ··· | ··· | ··· | 475 |
| a Quenched and tempered to Ftu indicated. If the material is exposed to temperatures exceeding those listed, a reduction in strength is likely to occur. | |||||||
Low-alloy steels may undergo a transition from ductile to brittle behavior at low temperatures. This transition temperature varies widely for different alloys. Caution should be exercised in the application of low-alloy steels at temperatures below −100°F. For use at a temperature below −100°F, an alloy with a transition temperature below the service temperature should be selected. For low temperatures, the steel should be heat treated to a tempered martensitic condition for maximum toughness.
Heat-treated alloy steels have better notch toughness than carbon steels at equivalent strength levels. The decrease in notch toughness is less pronounced and occurs at lower temperatures. Heat-treated alloy steels may be useful for subzero applications, depending on their alloy content and heat treatment. Heat treating to strength levels higher than 150 ksi Fty may decrease notch toughness.
The corrosion properties of the AISI alloy steels are comparable to the plain carbon steels.
AISI 4130 is a chromium-molybdenum steel that is in general use due to its well-established heat-treating practices and processing techniques. It is available in all sizes of sheet, plate, and tubing. Bar stock of this material is also used for small forgings under one-half inch in thickness. AISI 4135, a slightly higher carbon version of AISI 4130, is available in sheet, plate, and tubing.
AISI 4140 is a chromium-molybdenum steel that can be heat treated in thicker sections and to higher strength levels than AISI 4130. This steel is generally used for structural machined and forged parts one-half inch and over in thickness. It can be welded but it is more difficult to weld than the lower carbon grade AISI 4130.
AISI 4340 is a nickel-chromium-molybdenum steel that can be heat treated in thicker sections and to higher strength levels than AISI 4140.
AISI 8630, 8735, and 8740 are nickel-chromium-molybdenum steels that are considered alternates to AISI 4130, 4135, and 4140, respectively.
There are a number of steels available with compositions that represent modifications to the AISI grades described above. Four of the steels that have been used rather extensively at Ftu = 220 ksi are D6AC, Hy-Tuf, 4330V, and 4335V. It should be noted that this strength level is not used for AISI 4340 due to embrittlement encountered during tempering in the range of 500 to 700°F. In addition, AISI 4340 and 300M are utilized at strength levels of Ftu = 260 ksi or higher. The alloys AISI 4340, D6AC, 4330V, 4335V, and 300M are available in the consumable electrode melted grade. Material specifications for these steels are presented in Tables 2.3.1.0(a) and (b).
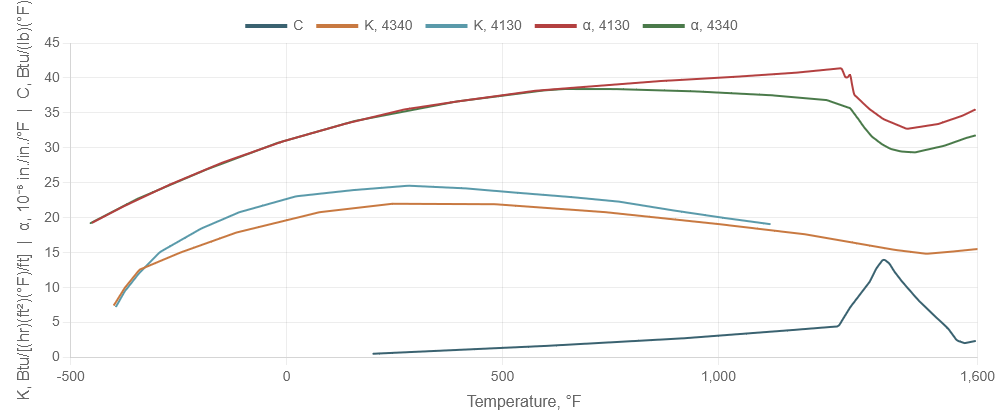
The room-temperature mechanical and physical properties for these steels are presented in Tables 2.3.1.0(c) through 2.3.1.0(g). Mechanical properties for heat-treated materials are valid only for steel heat treated to produce a quenched structure containing 90 percent or more martensite at the center. Figure 2.3.1.0 contains elevated temperature curves for the physical properties of AISI 4130 and AISI 4340 steels.
| Alloy | Form | ||
|---|---|---|---|
| Sheet, Strip, and Plate | Bars and Forgings | Tubing | |
| 4130 | AMS-S-18729, AMS 6350a, AMS 6351a | AMS-S-6758a, AMS 6348a, AMS 6370a, AMS 6528a | AMS-T-6736, AMS 6371a, AMS 6360, AMS 6361, AMS 6362, AMS 6373, AMS 6374 |
| 8630 | AMS-S-18728b, AMS 6350a | AMS-S-6050, AMS 6280a | AMS 6281a |
| 4135 | AMS 6352a | ··· | AMS 6372a, AMS 6365, AMS-T-6735b |
| 8735 | AMS 6357a | AMS 6320a | AMS 6282a |
| 4140 | AMS 6395a | AMS-S-5626a, AMS 6382a, AMS 6349a, AMS 6529a | AMS 6381a |
| 4340 | AMS 6359a | AMS-S-5000a, AMS 6415a | AMS 6415a |
| 8740 | AMS 6358a | AMS-S-6049b, AMS 6327, AMS 6322a | AMS 6323a |
| 4330V | ··· | AMS 6427a | AMS 6427a |
| 4335V | AMS 6433 | AMS 6430 | AMS 6430 |
| a Specification does not contain minimum mechanical properties. | |||
| b Noncurrent specification. | |||
| Alloy | Form | ||
|---|---|---|---|
| Sheet, Strip, and Plate | Bar and Forgings | Tubing | |
| 4340 | AMS 6454a | AMS 6414 | AMS 6414 |
| D6AC | AMS 6439 | AMS 6431, AMS 6439 | AMS 6431 |
| 4330V | ··· | AMS 6411 | AMS 6411 |
| Hy-Tuf | ··· | AMS 6425 | AMS 6425 |
| 4335V | AMS 6435 | AMS 6429 | AMS 6429 |
| 300M (0.40C) | ··· | AMS 6417 | AMS 6417 |
| 300M (0.42C) | ··· | AMS 6419, AMS 6257 | AMS 6419, AMS 6257 |
| a Specification does not contain minimum mechanical properties. | |||
| Alloy | AISI 4130 | AISI 4135 | AISI 8630 | |||
|---|---|---|---|---|---|---|
| Thickness or diameter, in. | ≤0.188 | >0.188 | ≤0.188 | ≤0.188 | ≤0.188 | ≤0.188 |
| Specification [see Tables 2.3.1.0(a) and (b)] | AMS 6360, AMS 6373, AMS 6374, AMS-T-6736, AMS-S-18729 | AMS 6365 | AMS-T-6735a | AMS-S-18728a | ||
| Form | Sheet, strip, plate, and tubing | Tubing | Sheet, strip, and plate | |||
| Condition | Normalized and tempered, stress relievedb | |||||
| Basis | S | S | S | S | S | S |
| Mechanical Properties: | ||||||
| Ftu, ksi | 95 | 90 | 100 | 95 | 95 | 90 |
| Fty, ksi | 75 | 70 | 85 | 80 | 75 | 70 |
| Fcy, ksi | 75 | 70 | 89 | 84 | 75 | 70 |
| Fsu, ksi | 57 | 54 | 60 | 57 | 57 | 54 |
| Fbru, ksi: | ||||||
| (e/D = 1.5) | ··· | ··· | ··· | ··· | ··· | ··· |
| (e/D = 2.0) | 200 | 190 | 190 | 180 | 200 | 190 |
| Fbry, ksi: | ||||||
| (e/D = 1.5) | ··· | ··· | ··· | ··· | ··· | ··· |
| (e/D = 2.0) | 129 | 120 | 146 | 137 | 129 | 120 |
| e, percent | See Table 2.3.1.0(d) | |||||
| E, 103 ksi | 29.0 | |||||
| Ec, 103 ksi | 29.0 | |||||
| G, 103 ksi | 11.0 | |||||
| μ | 0.32 | |||||
| Physical Properties: | ||||||
| ω, lb/in.3 | 0.283 | |||||
| C, K, and α | See Figure 2.3.1.0 | |||||
| a Noncurrent specification. | ||||||
| b Design values are applicable only to parts for which the indicated Ftu has been substantiated by adequate quality control testing. | ||||||
| Alloy | AISI 4130 | ||
|---|---|---|---|
| Thickness or diameter, in. | ≤0.188 | ≤0.188 | All Walls |
| Specification [see Tables 2.3.1.0(a) and (b)] | AMS 6361 AMS-T-6736 |
AMS 6362 AMS-T-6736 |
AMS-T-6736 |
| Form | Tubing | ||
| Condition | Quenched and tempereda | ||
| Basis | S | S | S |
| Mechanical Properties: | |||
| Ftu, ksi | 125 | 150 | 180 |
| Fty, ksi | 100 | 135 | 165 |
| Fcy, ksi | 109 | 141 | 173 |
| Fsu, ksi | 75 | 90 | 108 |
| Fbru, ksi: | |||
| (e/D = 1.5) | 194 | 231 | 277 |
| (e/D = 2.0) | 251 | 285 | 342 |
| Fbry, ksi: | |||
| (e/D = 1.5) | 146 | 210 | 257 |
| (e/D = 2.0) | 175 | 232 | 284 |
| e, percent | See Table 2.3.1.0(e) | ||
| E, 103 ksi | 29.0 | ||
| Ec, 103 ksi | 29.0 | ||
| G, 103 ksi | 11.0 | ||
| μ | 0.32 | ||
| Physical Properties: | |||
| ω, lb/in.3 | 0.283 | ||
| C, K, and α | See Figure 2.3.1.0 | ||
| a Design values are applicable only to parts for which the indicated Ftu has been substantiated by adequate quality control testing. | |||
| Alloy | AISI 8630 | AISI 8740 | |
|---|---|---|---|
| Specification [see Tables 2.3.1.0(a) and (b)] | AMS-S-6050 | AMS-S-6049a | AMS 6327 |
| Form | Bars and forgings | ||
| Condition | Quenched and temperedb | ||
| Thickness or diameter, in. | ≤1.500 | ≤1.750 | |
| Basis | S | S | |
| Mechanical Properties: | |||
| Ftu, ksi | 125 | 125 | 125 |
| Fty, ksi | 100 | 103 | 100 |
| Fcy, ksi | 109 | 108 | 109 |
| Fsu, ksi | 75 | 75 | 75 |
| Fbru, ksi: | |||
| (e/D = 1.5) | 194 | 192 | 194 |
| (e/D = 2.0) | 251 | 237 | 251 |
| Fbry, ksi: | |||
| (e/D = 1.5) | 146 | 160 | 146 |
| (e/D = 2.0) | 175 | 177 | 175 |
| e, percent | See Table 2.3.1.0(e) | ||
| E, 103 ksi | 29.0 | ||
| Ec, 103 ksi | 29.0 | ||
| G, 103 ksi | 11.0 | ||
| μ | 0.32 | ||
| Physical Properties: | |||
| ω, lb/in.3 | 0.283 | ||
| C, K, and α | See Figure 2.3.1.0 | ||
| a Noncurrent specification. | |||
| b Design values are applicable only to parts for which the indicated Ftu has been substantiated by adequate quality control testing. | |||
| Alloy | AISI 4135 | |||
|---|---|---|---|---|
| Specification [see Tables 2.3.1.0(a) and (b)] | AMS-T-6735 | |||
| Form | Tubing | |||
| Condition | Quenched and tempereda | |||
| Wall thickness, in. | ≤0.8 | < 0.5b | ||
| Basis | S | S | S | S |
| Mechanical Properties: | ||||
| Ftu, ksi | 125 | 150 | 180 | 200 |
| Fty, ksi | 100 | 135 | 165 | 165 |
| Fcy, ksi | 109 | 141 | 173 | 181 |
| Fsu, ksi | 75 | 90 | 108 | 120 |
| Fbru, ksi: | ||||
| (e/D = 1.5) | 194 | 231 | 277 | 308 |
| (e/D = 2.0) | 251 | 285 | 342 | 380 |
| Fbry, ksi: | ||||
| (e/D = 1.5) | 146 | 210 | 257 | 274 |
| (e/D = 2.0) | 175 | 232 | 284 | 302 |
| e, percent | See Table 2.3.1.0(e) | |||
| E, 103 ksi | 29.0 | |||
| Ec, 103 ksi | 29.0 | |||
| G, 103 ksi | 11.0 | |||
| μ | 0.32 | |||
| Physical Properties: | ||||
| ω, lb/in.3 | 0.283 | |||
| C, K, and α | See Figure 2.3.1.0 | |||
| a Design values are applicable only to parts for which the indicated Ftu and through hardening has been substantiated by adequate quality control testing. | ||||
| b Wall thickness at which through hardening is achieved and verified through quality control testing. | ||||
| b The S-basis value in MIL-T-6735 is 165 kst. | ||||
| Form | Thickness, in. | Elongation, percent | |
|---|---|---|---|
| Full tube | Strip | ||
| Sheet, strip, and plate (T) | Less than 0.062 | –– | 8 |
| Over 0.062 to 0.125 incl. | –– | 10 | |
| Over 0.125 to 0.187 incl. | –– | 12 | |
| Over 0.187 to 0.249 incl. | –– | 15 | |
| Over 0.249 to 0.749 incl. | –– | 16 | |
| Over 0.749 to 1.500 incl. | –– | 18 | |
| Tubing (L) | Up to 0.035 incl. (wall) | 10 | 5 |
| Over 0.035 to 0.188 incl. | 12 | 7 | |
| Over 0.188 | 15 | 10 | |
| Elongation in 2 in., percent | |||||||
|---|---|---|---|---|---|---|---|
| Round specimens (L) | Sheet specimens | Tubing (L) | |||||
| Ftu, ksi | Elongation in 4D, percent | Reduction of area, percent | Less than 0.032 in. thick | 0.032 to 0.060 in. thick | Over 0.060 in. thick | Full tube | Strip |
| 125 | 17 | 55 | 5 | 7 | 10 | 12 | 7 |
| 140 | 15 | 53 | 4 | 6 | 9 | 10 | 6 |
| 150 | 14 | 52 | 4 | 6 | 9 | 10 | 6 |
| 160 | 13 | 50 | 3 | 5 | 8 | 9 | 6 |
| 180 | 12 | 47 | 3 | 5 | 7 | 8 | 5 |
| 200 | 10 | 43 | 3 | 4 | 6 | 6 | 5 |
| Alloy | Hy-Tuf | 4330V | 4335V | 4335V | D6AC | AISI 4340a | 0.40C 300M |
0.42C 300M |
|---|---|---|---|---|---|---|---|---|
| Specification | AMS 6425 | AMS 6411 | AMS 6430 | AMS 6429 | AMS 6431 | AMS 6414 | AMS 6417 | AMS 6257 AMS 6419 |
| Form | Bar, forging, tubing | |||||||
| Condition | Quenched and temperedb | |||||||
| Thickness or diameter, in. | c | d | c | f | ||||
| Basis | S | S | S | S | S | S | S | S |
| Mechanical Properties: | ||||||||
| Ftu, ksi | 220 | 220 | 205 | 240 | 220 | 260 | 270 | 280 |
| Fty, ksi | 185 | 185 | 190 | 210 | 190 | 217 | 220 | 230 |
| Fcy, ksi | 193 | 193 | 199 | 220 | 198 | 235 | 236 | 247 |
| Fsu, ksi | 132 | 132 | 123 | 144 | 132 | 156 | 162 | 168 |
| Fbru, ksi: | ||||||||
| (e/D = 1.5) | 297 | 297 | 315 | 369 | 297 | 347 | 414g | 430g |
| (e/D = 2.0) | 385 | 385 | 389 | 465 | 385 | 440 | 506g | 525g |
| Fbry, ksi: | ||||||||
| (e/D = 1.5) | 267 | 267 | 296 | 327 | 274 | 312 | 344g | 360g |
| (e/D = 2.0) | 294 | 294 | 327 | 361 | 302 | 346 | 379g | 396g |
| e, percent: | ||||||||
| L | 10 | 10 | 10 | 10 | 12 | 10 | 8 | 7 |
| LT | 5a | 5a | 7 | 7 | 9 | … | … | … |
| E, 103 ksi | 29.0 | |||||||
| Ec, 103 ksi | 29.0 | |||||||
| G, 103 ksi | 11.0 | |||||||
| μ | 0.32 | |||||||
| Physical Properties: | ||||||||
| ω, lb/in.3 | 0.283 | |||||||
| C, K, and α | See Figure 2.3.1.0 | |||||||
| a Applicable to consumable-electrode vacuum-melted material only. | ||||||||
| b Design values are applicable only to parts for which the indicated Ftu has been substantiated by adequate quality control testing. | ||||||||
| c Thickness ≤ 1.70 in. for quenching in molten salt at desired tempering temperature (martempering); ≤2.50 in. for quenching in oil at flow rate of 200 feet/min. | ||||||||
| d Thickness ≤ 3.50 in. for quenching in molten salt at desired tempering temperature (martempering); ≤5.00 in. for quenching in oil at flow rate of 200 feet/min. | ||||||||
| e Thickness ≤ 1.70 in. for quenching in molten salt at desired tempering temperature (martempering); ≤2.50 in. for quenching in oil at flow rate of 200 feet/min.; ≤3.50 in. for quenching in water at a flow rate of 200 feet/min. | ||||||||
| f Thickness ≤5.00 in. for quenching in oil at a flow rate of 200 feet/min. | ||||||||
| g Bearing values are “dry pin” values per Section 1.4.7.1. | ||||||||
| Alloy | 4335V | D6AC | |
|---|---|---|---|
| Specification [see Tables 2.3.1.0(a) and (b)] | AMS 6435 | AMS 6439 | |
| Form | Sheet, strip, and plate | ||
| Condition | Quenched and tempereda | ||
| Thickness or diameter, in. | b | ≤0.250 | ≥0.251 |
| Basis | S | S | S |
| Mechanical Properties: | |||
| Ftu, ksi | 220 | 215 | 224 |
| Fty, ksi | 190 | 190 | 195 |
| Fcy, ksi | 198 | 198 | 203 |
| Fsu, ksi | 132 | 129 | 134 |
| Fbru, ksi:c | |||
| (e/D = 1.5) | 297 | 290 | 302 |
| (e/D = 2.0) | 385 | 376 | 392 |
| Fbry, ksi:c | |||
| (e/D = 1.5) | 274 | 274 | 281 |
| (e/D = 2.0) | 302 | 302 | 310 |
| e, percent: | |||
| L | 10 | … | … |
| LT | 7 | 7 | 7 |
| E, 103 ksi | 29.0 | ||
| Ec, 103 ksi | 29.0 | ||
| G, 103 ksi | 11.0 | ||
| μ | 0.32 | ||
| Physical Properties: | |||
| ω, lb/in.3 | 0.283 | ||
| C, K, and α | See Figure 2.3.1.0 | ||
| a Design values are applicable only to parts for which the indicated Ftu has been substantiated by adequate quality control testing. | |||
| b Thickness ≤1.70 in. for quenching in molten salt at desired tempering temperature (martempering); ≤2.50 in. for quenching in oil at a flow rate of 200 feet/min. | |||
| c Bearing values are “dry pin” values per Section 1.4.7.1. | |||
| Alloy | AISI 4130 | AISI 4135 | AISI 8630 | AISI 8735 | ||||
|---|---|---|---|---|---|---|---|---|
| Specification [see Tables 2.3.1.0(a) and (b)] | AMS 6350 AMS 6528 AMS-S-6758 |
AMS 6352 AMS 6372 |
AMS 6281 | AMS 6357 | ||||
| Form | Sheet, strip, plate, bars, and forgings | Sheet, strip, plate, and tubing | Tubing | Sheet, strip, and plate | ||||
| Condition | Normalized and tempered, stress relieveda | |||||||
| Thickness or diameter, in. | ≤0.188 | >0.188 | ≤0.188 | >0.188 | ≤0.188 | >0.188 | ≤0.188 | >0.188 |
| Basis | b | |||||||
| Mechanical Properties: | ||||||||
| Ftu, ksi | 95 | 90 | 95 | 90 | 95 | 90 | 95 | 90 |
| Fty, ksi | 75 | 70 | 75 | 70 | 75 | 70 | 75 | 70 |
| Fcy, ksi | 75 | 70 | 75 | 70 | 75 | 70 | 75 | 70 |
| Fsu, ksi | 57 | 54 | 57 | 54 | 57 | 54 | 57 | 54 |
| Fbru, ksi: | ||||||||
| (e/D = 1.5) | … | … | … | … | … | … | … | … |
| (e/D = 2.0) | 200 | 190 | 200 | 190 | 200 | 190 | 200 | 190 |
| Fbry, ksi: | ||||||||
| (e/D = 1.5) | … | … | … | … | … | … | … | … |
| (e/D = 2.0) | 129 | 120 | 129 | 120 | 129 | 120 | 129 | 120 |
| e, percent | See Table 2.3.1.0(d) | |||||||
| E, 103 ksi | 29.0 | |||||||
| Ec, 103 ksi | 29.0 | |||||||
| G, 103 ksi | 11.0 | |||||||
| μ | 0.32 | |||||||
| Physical Properties: | ||||||||
| ω, lb/in.3 | 0.283 | |||||||
| C, K, and α | See Figure 2.3.1.0 | |||||||
| a Design values are applicable only to parts for which the indicated Ftu has been substantiated by adequate quality control testing. | ||||||||
| b There is no statistical basis (T99 or T90) or specification basis (S) to support the mechanical property values in this table. See Heat Treatment in Section 2.3.0.2. | ||||||||
| Alloy | 4330V | See steels listed in Table 2.3.0.2 for the applicable strength levels | |||||
|---|---|---|---|---|---|---|---|
| Specification [see Tables 2.3.1.0(a) and (b)] | AMS 6427 | See Tables 2.3.1.0(a) and (b) | |||||
| Form | All wrought forms | ||||||
| Condition | Quenched and tempereda | ||||||
| Thickness or diameter, in. | ≤ 2.5 | b | c | ||||
| Basis | d | ||||||
| Mechanical Properties: | |||||||
| Ftu, ksi | 220 | 125 | 140 | 150 | 160 | 180 | 200 |
| Fty, ksi | 185 | 100 | 120 | 132 | 142 | 163 | 176 |
| Fcy, ksi | 193 | 109 | 131 | 145 | 154 | 173 | 181 |
| Fsu, ksi | 132 | 75 | 84 | 90 | 96 | 108 | 120 |
| Fbru, ksi: | |||||||
| (e/D = 1.5) | 297 | 209 | 209 | 219 | 230 | 250 | 272 |
| (e/D = 2.0) | 385 | 251 | 273 | 287 | 300 | 326 | 355 |
| Fbry, ksi: | |||||||
| (e/D = 1.5) | 267 | 146 | 173 | 189 | 202 | 230 | 255 |
| (e/D = 2.0) | 294 | 175 | 203 | 218 | 231 | 256 | 280 |
| e, percent: | |||||||
| L | 10 | See Table 2.3.1.0(e) | |||||
| LT | 5a | ||||||
| E, 103 ksi | 29.0 | ||||||
| Ec, 103 ksi | 29.0 | ||||||
| G, 103 ksi | 11.0 | ||||||
| μ | 0.32 | ||||||
| Physical Properties: | |||||||
| ω, lb/in.3 | 0.283 | ||||||
| C, K, and α | See Figure 2.3.1.0 | ||||||
| a Design values are applicable only to parts for which the indicated Ftu has been substantiated by adequate quality control testing. | |||||||
| b For Ftu < 180 ksi, thickness < 0.50 in. for AISI 4130 and 8630; < 0.80 in. for AISI 8735, 4135, and 8740; < 1.00 in. for AISI 4140; < 1.70 in. for AISI 4340, 4330V, 4335V, and Hy-Tuf [Quenched in molten salt at desired tempering temperature (martempering)]; < 2.50 in. for AISI 4340, 4330V, 4335V, and Hy-Tuf (Quenched in oil at a flow rate of 200 feet/min.); < 3.50 in. for AISI 4340 (Quenched in water at a flow rate of 200 feet/min.); ≤ 5.00 in. for D6AC (Quenched in oil at a flow rate of 200 feet/min.) | |||||||
| c For Ftu = 200 ksi, AISI 4130, 8630, 4135, 8740 not available; thickness < 0.80 in. for AISI 8740; < 1.00 in. for AISI 4140; < 1.70 in. for AISI 4340, 4330V, 4335V, and Hy-Tuf [Quenched in molten salt at desired tempering temperature (martempering)]; < 2.50 in. for AISI 4340, 4330V, 4335V, and Hy-Tuf (Quenched in oil at a flow rate of 200 feet/min.); < 3.50 in. for AISI 4340 (Quenched in water at a flow rate of 200 feet/min.); ≤ 5.00 in. for D6AC (Quenched in oil at a flow rate of 200 feet/min.) | |||||||
| d There is no statistical basis (T99 or T90) or specification basis (S) to support the mechanical property values in this table. See Heat Treatment in Section 2.3.0.2. | |||||||
C — At indicated temperature | K — At indicated temperature | α — Between 70°F and indicated temperature
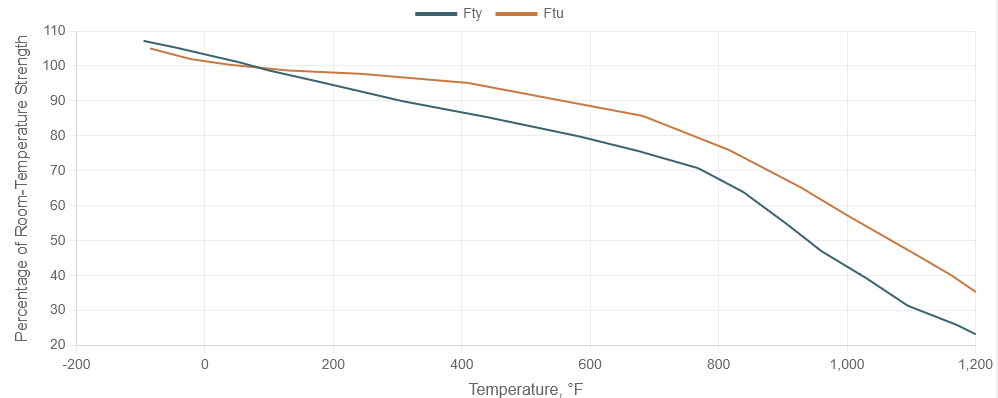
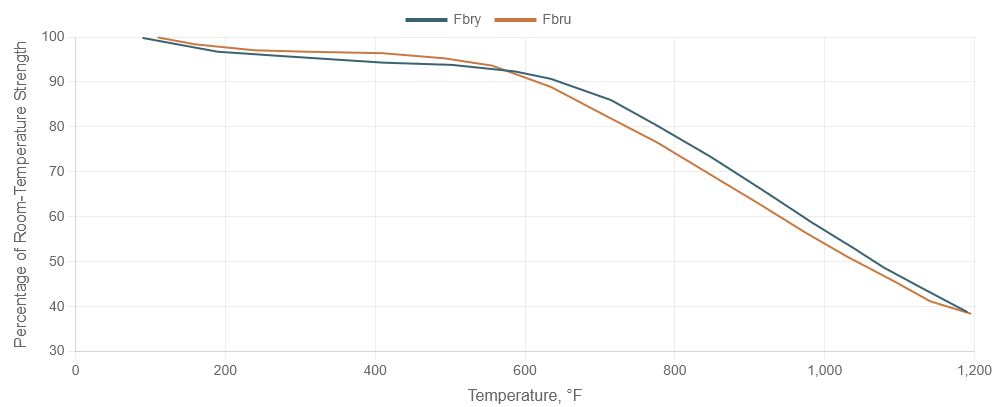
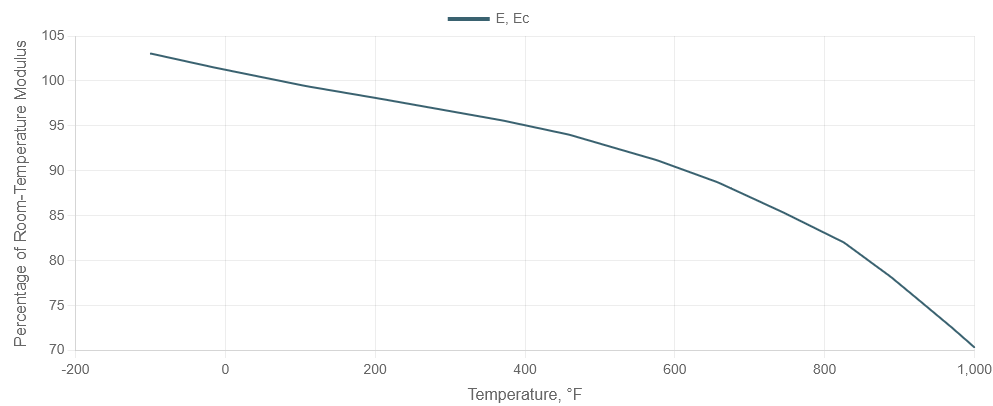
Elevated temperature curves for heat-treated AISI low-alloy steels are presented in Figures 2.3.1.1.1 through 2.3.1.1.4. These curves are considered valid for each of these steels in each heat-treated condition but only up to the maximum temperatures listed in Table 2.3.0.1(b).
Figure 2.3.1.1.1. Effect of temperature on the tensile ultimate strength (Ftu) and tensile yield strength (Fty) of AISI low-alloy steels (all products).
Strength at temperature | Exposure up to ½ hr
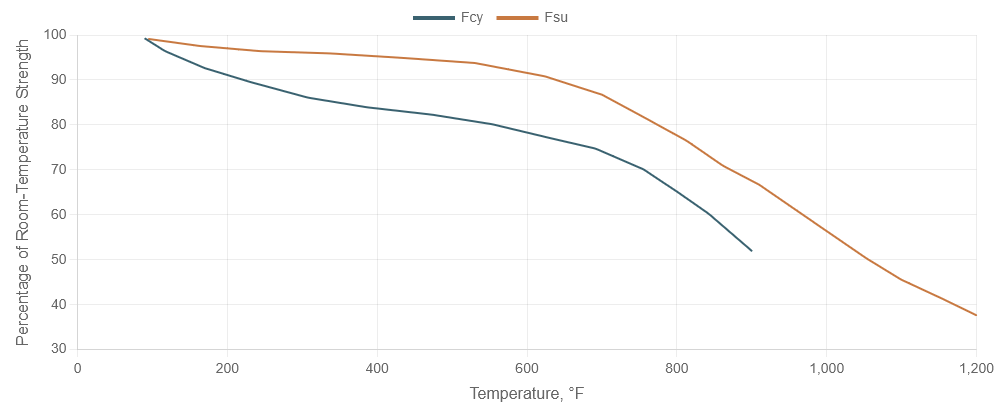
Figure 2.3.1.1.2. Effect of temperature on the compressive yield strength (Fcy) and the shear ultimate strength (Fsu) of heat-treated AISI low-alloy steels (all products).
Strength at temperature | Exposure up to ½ hr
Figure 2.3.1.1.3. Effect of temperature on the bearing ultimate strength (Fbru) and the bearing yield strength (Fbry) of heat-treated AISI low-alloy steels (all products).
Strength at temperature | Exposure up to ½ hr
Figure 2.3.1.1.4. Effect of temperature on the tensile and compressive modulus (E and Ec) of AISI low-alloy steels.
Modulus at temperature | Exposure up to ½ hr
Typical stress-strain and tangent-modulus curves for AISI 8630 are shown in Figures 2.3.1.2.6(a) through (c). Best-fit S/N curves for AISI 4130 steel are presented in Figures 2.3.1.2.8(a) through (h).
.png)
Figure 2.3.1.2.6(a). Typical tensile stress-strain curves at room temperature for heat-treated AISI 8630 alloy steel (all products).
.png)
Figure 2.3.1.2.6(b). Typical compressive tangent-modulus curves at room temperature for heat-treated AISI 8630 alloy steel (all products).
.png)
Figure 2.3.1.2.6(c). Typical tensile stress-strain curves at elevated temperatures for heat-treated AISI 8630 alloy steel, Ftu = 125 ksi (all products).
Ramberg-Osgood | n (500°F) = 9.0 | n (850°F) = 19 | n (1000°F) = 4.4 | ½-hr exposure
.png)
Figure 2.3.1.2.8(a). Best-fit S/N curves for unnotched 4130 alloy steel sheet, normalized, longitudinal direction.
Stresses are based on net sections.
| Correlative Information for Figure 2.3.1.2.8(a) | |||||||
|
Product Form: Sheet, 0.075 inch thick Properties:
Specimen Details: Unnotched Surface Condition: Electropolished References: 3.2.3.1.8(a) and (f) [Caution: The equivalent stress model may provide unrealistic life predictions for stress ratios beyond those represented above.] |
Test Parameters: No. of Heats/Lots: Not specified
Equivalent Stress Equations: Sample Size = 23
For a stress ratio of −1.0 |
||||||
.png)
Figure 2.3.1.2.8(b). Best-fit S/N curves for notched, Kt = 1.5, 4130 alloy steel sheet, normalized, longitudinal direction.
Stresses are based on net sections.
| Correlative Information for Figure 2.3.1.2.8(b) | ||||||||||
|
Product Form: Sheet, 0.075 inch thick Properties:
Specimen Details: Edge Notched, Kt = 1.5 Surface Condition: Electropolished Reference: 3.2.3.1.8(d) |
Test Parameters: No. of Heats/Lots: Not specified
Equivalent Stress Equations: Sample Size = 21 [Caution: The equivalent stress model may provide unrealistic life predictions for stress ratios beyond those represented above.] |
|||||||||
.png)
Figure 2.3.1.2.8(c). Best-fit S/N curves for notched, Kt = 2.0, 4130 alloy steel sheet, normalized, longitudinal direction.
Stresses are based on net sections.
| Correlative Information for Figure 2.3.1.2.8(c) | ||||||||||||||||||||||||||
|
Product Form: Sheet, 0.075 inch thick Properties:
Specimen Details: Notched, Kt = 2.0
Surface Condition: Electropolished References: 3.2.3.1.8(b) and (f) |
Test Parameters: Loading - Axial Frequency - 1100-1800 cpm Temperature - RT Environment - Air No. of Heats/Lots: Not specified Equivalent Stress Equation: Log Nf = 17.1-6.49 log (Seq) Seq = Smax (1-R)0.86 Std. Error of Estimate, Log (Life) = 0.19 Standard Deviation, Log (Life) = 0.78 R² = 94% Sample Size = 107 [Caution: The equivalent stress model may provide unrealistic life predictions for stress ratios beyond those represented above.] |
|||||||||||||||||||||||||
.png)
Figure 2.3.1.2.8(d). Best-fit S/N curves for notched, Kt = 4.0, 4130 alloy steel sheet, normalized, longitudinal direction.
Stresses are based on net sections.
| Correlative Information for Figure 2.3.1.2.8(d) | ||||||||||||||||||||||||||
|
Product Form: Sheet, 0.075 inch thick Properties:
Specimen Details: Notched, Kt = 4.0
Surface Condition: Electropolished References: 3.2.3.1.8(b), (f), and (g) |
Test Parameters: Loading - Axial Frequency - 1100-1800 cpm Temperature - RT Environment - Air No. of Heats/Lots: Not specified Equivalent Stress Equation: Log Nf = 12.6-4.69 log (Seq) Seq = Smax (1-R)0.63 Std. Error of Estimate, Log (Life) = 0.24 Standard Deviation, Log (Life) = 0.70 R² = 88% Sample Size = 87 [Caution: The equivalent stress model may provide unrealistic life predictions for stress ratios beyond those represented above.] |
|||||||||||||||||||||||||
.png)
Figure 2.3.1.2.8(e). Best-fit S/N curves for notched, Kt = 5.0, 4130 alloy steel sheet, normalized, longitudinal direction.
Stresses are based on net sections.
| Correlative Information for Figure 2.3.1.2.8(e) | ||||||||||
|
Product Form: Sheet, 0.075 inch thick Properties:
Specimen Details: Edge Notched, Kt = 5.0 2.25 inches gross width 1.50 inches net width 0.075 inch notch radius Surface Condition: Electropolished Reference: 3.2.3.1.8(c) |
Test Parameters: Loading - Axial Frequency - 1100-1500 cpm Temperature - RT Environment - Air No. of Heats/Lots: Not specified Equivalent Stress Equation: Log Nf = 12.0-4.57 log (Seq) Seq = Smax (1-R)0.56 Std. Error of Estimate, Log (Life) = 0.18 Standard Deviation, Log (Life) = 0.87 R² = 96% Sample Size = 38 [Caution: The equivalent stress model may provide unrealistic life predictions for stress ratios beyond those represented above.] |
|||||||||
.png)
Figure 2.3.1.2.8(f). Best-fit S/N curves for unnotched 4130 alloy steel sheet, Ftu = 180 ksi, longitudinal direction.
Stresses are based on net sections.
| Correlative Information for Figure 2.3.1.2.8(f) | |||||||
|
Product Form: Sheet, 0.075 inch thick Properties:
Specimen Details: Unnotched 2.88 inches gross width 1.00 inch net width 12.0 inch net section radius Surface Condition: Electropolished Reference: 3.2.3.1.8(f) |
Test Parameters: Loading - Axial Frequency - 20-1800 cpm Temperature - RT Environment - Air No. of Heats/Lots: Not specified Equivalent Stress Equation: Log Nf = 20.3-7.31 log (Seq) Seq = Smax (1-R)0.49 Std. Error of Estimate, Log (Life) = 0.39 Standard Deviation, Log (Life) = 0.89 R² = 81% Sample Size = 27 [Caution: The equivalent stress model may provide unrealistic life predictions for stress ratios beyond those represented above.] |
||||||
.png)
Figure 2.3.1.2.8(g). Best-fit S/N curves for notched, Kt = 2.0, 4130 alloy steel sheet, Ftu = 180 ksi, longitudinal direction.
Stresses are based on net sections.
| Correlative Information for Figure 2.3.1.2.8(g) | |||||||
|
Product Form: Sheet, 0.075 inch thick Properties:
Specimen Details: Edge Notched 2.25 inches gross width 1.50 inches net width 0.3175 inch notch radius Surface Condition: Electropolished Reference: 3.2.3.1.8(f) |
Test Parameters: Loading - Axial Frequency - 21-1800 cpm Temperature - RT Environment - Air No. of Heats/Lots: Not specified Equivalent Stress Equation: Log Nf = 8.87-2.81 log (Seq - 41.5) Seq = Smax (1-R)0.46 Std. Error of Estimate, Log (Life) = 0.18 Standard Deviation, Log (Life) = 0.77 R² = 94% Sample Size = 19 [Caution: The equivalent stress model may provide unrealistic life predictions for stress ratios beyond those represented above.] |
||||||
.png)
Figure 2.3.1.2.8(h). Best-fit S/N curves for notched, Kt = 4.0, 4130 alloy steel sheet, Ftu = 180 ksi, longitudinal direction.
Stresses are based on net sections.
| Correlative Information for Figure 2.3.1.2.8(h) | |||||||
|
Product Form: Sheet, 0.075 inch thick Properties:
Specimen Details: Edge Notched 2.25 inches gross width 1.50 inches net width 0.057 inch notch radius Surface Condition: Electropolished Reference: 3.2.3.1.8(f) |
Test Parameters: Loading - Axial Frequency - 23-1800 cpm Temperature - RT Environment - Air No. of Heats/Lots: Not specified Equivalent Stress Equation: Log Nf = 12.4-4.45 log (Seq) Seq = Smax (1-R)0.60 Std. Error of Estimate, Log (Life) = 0.11 Standard Deviation, Log (Life) = 0.90 R² = 98% Sample Size = 20 [Caution: The equivalent stress model may provide unrealistic life predictions for stress ratios beyond those represented above.] |
||||||
Typical stress-strain and tangent-modulus curves for AISI 4340 are shown in Figures 2.3.1.3.6(a) through (c). Typical biaxial stress-strain curves and yield-stress envelopes for AISI 4340 alloy steel are presented in Figures 2.3.1.3.6(d) through (g). Best-fit S/N curves for AISI 4340 are presented in Figures 2.3.1.3.8(a) through (o).
.png)
Figure 2.3.1.3.6(a). Typical tensile stress-strain curves at room temperature for heat-treated AISI 4340 alloy steel (all products).
.png)
Figure 2.3.1.3.6(b). Typical tensile stress-strain curves at cryogenic and room temperature for AISI 4340 alloy steel bar, Ftu = 260 ksi.
Longitudinal ½-hr exposure
Ramberg-Osgood: n (RT) = 7.0 | n (−110°F) = 8.2 | n (−312°F) = 8.9
.png)
Figure 2.3.1.3.6(c1). Typical compressive stress-strain curve at room temperature for AISI 4340 alloy steel bar, Ftu = 260 ksi.
.png)
Figure 2.3.1.3.6(c2). Typical compressive tangent-modulus curve at room temperature for AISI 4340 alloy steel bar, Ftu = 260 ksi.
.png)
Figure 2.3.1.3.6(d). Typical biaxial stress-strain curves at room temperature for AISI 4340 alloy steel (machined thin-wall cylinders), Ftu = 180 ksi. A biaxial ratio, B, denotes the ratio of hoop stresses to axial stresses.
.png)
Figure 2.3.1.3.6(e). Biaxial yield-stress envelope at room temperature for AISI 4340 alloy steel (machined thin-wall cylinders), Ftu = 180 ksi, Fty measured in the hoop direction.
Cylindrical Specimens.
.png)
Figure 2.3.1.3.6(f). Typical biaxial stress-strain curves at room temperature for AISI 4340 alloy steel (machined thin-wall cylinders), Ftu = 260 ksi. A biaxial ratio B of zero corresponds to the hoop direction.
.png)
Figure 2.3.1.3.6(g). Biaxial yield-stress envelope at room temperature for AISI 4340 alloy steel (machined thin-wall cylinders), Ftu = 260 ksi, Fty measured in the hoop direction.
Cylindrical Specimens.
.png)
Figure 2.3.1.3.8(a). Best-fit S/N curves for unnotched AISI 4340 alloy steel bar, Ftu = 125 ksi, longitudinal direction.
Kₜ = 1. Stresses are based on net section.
| Correlative Information for Figure 2.3.1.3.8(a) | ||||||||||
|
Product Form: Rolled bar, 1.125 inch diameter, air melted Properties:
Specimen Details: Unnotched 0.400 inch diameter Surface Condition: Hand polished to RMS 10 Reference: 2.3.1.3.8(a) |
Test Parameters: Loading - Axial Frequency - 2000 to 2500 cpm Temperature - RT Atmosphere - Air No. of Heat/Lots: 1 Equivalent Stress Equation: Log Nf = 14.96-6.46 log (Seq-60) Seq = Smax (1-R)0.70 Std. Error of Estimate, Log (Life) = 0.35 Standard Deviation, Log (Life) = 0.77 R² = 75% Sample Size = 9 [Caution: The equivalent stress model may provide unrealistic life predictions for stress ratios beyond those represented above.] |
|||||||||
.png)
Figure 2.3.1.3.8(b). Best-fit S/N curves for notched, Kt = 3.3, AISI 4340 alloy steel bar, Ftu = 125 ksi, longitudinal direction.
Kₜ = 3.3. Stresses are based on net section. Sample size does not meet guideline requirements.
| Correlative Information for Figure 2.3.1.3.8(b) | ||||||||||
|
Product Form: Rolled bar, 1.125 inch diameter, air melted Properties:
Specimen Details: Notched, V-Groove, Kt=3.3 0.450 inch gross diameter 0.400 inch net diameter 0.010 inch root radius, r 60° flank angle, ω Surface Condition: Lathe turned to RMS 10 Reference: 2.3.1.3.8(a) |
Test Parameters: Loading - Axial Frequency - 2000 to 2500 cpm Temperature - RT Atmosphere - Air No. of Heat/Lots: 1 Equivalent Stress Equation: Log Nf = 9.75-3.08 log (Seq-20.0) Seq = Smax (1-R)0.84 Std. Error of Estimate, Log (Life) = 0.40 Standard Deviation, Log (Life) = 0.90 R² = 80% Sample Size = 11 [Caution: The equivalent stress model may provide unrealistic life predictions for stress ratios beyond those represented above.] |
|||||||||
.png)
Figure 2.3.1.3.8(c). Best-fit S/N curves for unnotched AISI 4340 alloy steel bar, Ftu = 150 ksi, longitudinal direction.
Kₜ = 1. Stresses are based on net section. Sample size does not meet guideline requirements.
| Correlative Information for Figure 2.3.1.3.8(c) | ||||||||||
|
Product Form: Rolled bar, 1.125 inch diameter, air melted Properties:
Specimen Details: Unnotched 0.400 inch diameter Surface Condition: Hand polished to RMS 10 Reference: 2.3.1.3.8(b) |
Test Parameters: Loading - Axial Frequency - 2000 to 2500 cpm Temperature - RT Atmosphere - Air No. of Heat/Lots: 1 Equivalent Stress Equation: Log Nf = 10.76-3.91 log (Seq - 101.0) Seq = Smax (1-R)0.77 Std. Error of Estimate, Log (Life) = 0.17 Standard Deviation, Log (Life) = 0.33 Adjusted R² Statistic = 73% Sample Size = 9 [Caution: The equivalent stress model may provide unrealistic life predictions for stress ratios beyond those represented above.] |
|||||||||
.png)
Figure 2.3.1.3.8(d). Best-fit S/N curves for notched AISI 4340 alloy steel bar, Ftu = 150 ksi, longitudinal direction.
Kₜ = 3.3. Stresses are based on net section. Sample size does not meet guideline requirements.
| Correlative Information for Figure 2.3.1.3.8(d) | ||||||||||
|
Product Form: Rolled bar, 1.125 inch diameter, air melted Properties:
Specimen Details: Notched, V-Groove, Kt = 3.3 0.450 inch gross diameter 0.400 inch net diameter 0.010 inch root radius, r 60° flank angle, ω Surface Condition: Lathe turned to RMS 10 Reference: 2.3.1.3.8(a) |
Test Parameters: Loading - Axial Frequency - 2000 to 2500 cpm Temperature - RT Atmosphere - Air No. of Heat/Lots: 1 Equivalent Stress Equation: Log Nf = 7.90-2.00 log (Seq-40.0) Seq = Smax (1-R)0.60 Std. Error of Estimate, Log (Life) = 0.27 Standard Deviation, Log (Life) = 0.74 R² = 86% Sample Size = 11 [Caution: The equivalent stress model may provide unrealistic life predictions for stress ratios beyond those represented above.] |
|||||||||
.png)
Figure 2.3.1.3.8(e). Best-fit S/N curves for unnotched AISI 4340 alloy steel bar at 600°F, Ftu = 150 ksi, longitudinal direction.
Kₜ = 1. Stresses are based on net section. Sample size does not meet guideline requirements.
| Correlative Information for Figure 2.3.1.3.8(e) | ||||||||||||||||
|
Product Form: Rolled bar, 1.125 inch diameter, air melted Properties:
Specimen Details: Unnotched 0.400 inch diameter Surface Condition: Hand polished to RMS 10 Reference: 2.3.1.3.8(b) |
Test Parameters: Loading - Axial Frequency - 2000 to 2500 cpm Temperature - 600°F Atmosphere - Air No. of Heat/Lots: 1 Equivalent Stress Equation: Log Nf = 22.36-9.98 log (Seq-60.0) Seq = Smax (1-R)0.66 Std. Error of Estimate Log (Life) = 0.24 Standard Deviation, Log (Life) = 1.08 R² = 95% Sample Size = 11 [Caution: The equivalent stress model may provide unrealistic life predictions for stress ratios beyond those represented above.] |
|||||||||||||||
.png)
Figure 2.3.1.3.8(f). Best-fit S/N curves for notched, Kt = 3.3, AISI 4340 alloy steel bar at 600°F, Ftu = 150 ksi, longitudinal direction.
Kₜ = 3.3. Stresses are based on net section. Sample size does not meet guideline requirements.
| Correlative Information for Figure 2.3.1.3.8(f) | ||||||||||||||||
|
Product Form: Rolled bar, 1.125 inch diameter, air melted Properties:
Specimen Details: Notched, V-Groove, Kt = 3.3 0.450 inch gross diameter 0.400 inch net diameter 0.010 inch root radius, r 60° flank angle, ω Surface Condition: Lathe turned to RMS 10 Reference: 2.3.1.3.8(b) |
Test Parameters: Loading - Axial Frequency - 2000 to 2500 cpm Temperature - RT Atmosphere - Air No. of Heat/Lots: 1 Equivalent Stress Equation: Log Nf = 10.39-3.76 log (Seq-30.0) Seq = Smax (1-R)0.62 Std. Error of Estimate, Log (Life) = 0.36 Standard Deviation, Log (Life) = 1.06 R² = 89% Sample Size = 11 [Caution: The equivalent stress model may provide unrealistic life predictions for stress ratios beyond those represented above.] |
|||||||||||||||
.png)
Figure 2.3.1.3.8(g). Best-fit S/N curves for unnotched AISI 4340 alloy steel bar at 800°F, Ftu = 150 ksi, longitudinal direction.
Kₜ = 1. Stresses are based on net section. Sample size does not meet guideline requirements.
| Correlative Information for Figure 2.3.1.3.8(g) | ||||||||||||||||
|
Product Form: Rolled bar, 1.125 inch diameter, air melted Properties:
Specimen Details: Unnotched 0.400 inch diameter Surface Condition: Hand polished to RMS 10 Reference: 2.3.1.3.8(b) |
Test Parameters: Loading - Axial Frequency - 2000 to 2500 cpm Temperature - 800°F Atmosphere - Air No. of Heat/Lots: 1 Equivalent Stress Equation: Log Nf = 17.53-7.35 log (Seq-60.0) Seq = Smax (1-R)0.66 Std. Error of Estimate, Log (Life) = 0.42 Standard Deviation, Log (Life) = 0.99 R² = 82% Sample Size = 15 [Caution: The equivalent stress model may provide unrealistic life predictions for stress ratios beyond those represented above.] |
|||||||||||||||
.png)
Figure 2.3.1.3.8(h). Best-fit S/N curves for notched, Kt = 3.3, AISI 4340 alloy steel bar at 800°F, Ftu = 150 ksi, longitudinal direction.
Kₜ = 3.3. Stresses are based on net section. Sample size does not meet guideline requirements.
| Correlative Information for Figure 2.3.1.3.8(h) | ||||||||||||||||
|
Product Form: Rolled bar, 1.125 inch diameter, air melted Properties:
Specimen Details: Notched, V-Groove, Kt = 3.3 0.450 inch gross diameter 0.400 inch net diameter 0.010 inch root radius, r 60° flank angle, ω Surface Condition: Lathe turned to RMS 10 Reference: 2.3.1.3.8(b) |
Test Parameters: Loading - Axial Frequency - 2000 to 2500 cpm Temperature - 800°F Atmosphere - Air No. of Heat/Lots: 1 Equivalent Stress Equation: Log Nf = 7.31-2.01 log (Seq-48.6) Seq = Smax (1-R)0.92 Std. Error of Estimate, Log (Life) = 0.60 Standard Deviation, Log (Life) = 1.14 R² = 72% Sample Size = 9 [Caution: The equivalent stress model may provide unrealistic life predictions for stress ratios beyond those represented above.] |
|||||||||||||||
.png)
Figure 2.3.1.3.8(i). Best-fit S/N curves for unnotched AISI 4340 alloy steel bar at 1000°F, Ftu = 150 ksi, longitudinal direction.
Kₜ = 1. Stresses are based on net section. Sample size does not meet guideline requirements.
| Correlative Information for Figure 2.3.1.3.8(i) | ||||||||||||||||
|
Product Form: Rolled bar, 1.125 inch diameter, air melted Properties:
Specimen Details: Unnotched 0.400 inch diameter Surface Condition: Hand polished to RMS 10 Reference: 2.3.1.3.8(b) |
Test Parameters: Loading - Axial Frequency - 2000 to 2500 cpm Temperature - 1000°F Atmosphere - Air No. of Heat/Lots: 1 Equivalent Stress Equation: Log Nf = 16.85-7.02 log (Seq-40.0) Seq = Smax (1-R)0.80 Std. Error of Estimate, Log (Life) = 0.42 Standard Deviation, Log (Life) = 1.20 R² = 88% Sample Size = 13 [Caution: The equivalent stress model may provide unrealistic life predictions for stress ratios beyond those represented above.] |
|||||||||||||||
Figure 2.3.1.3.8(j). Best-fit S/N curves for notched, Kt = 3.3, AISI 4340 alloy steel bar at 1000°F, Ftu = 150 ksi, longitudinal direction.
Kₜ = 3.3. Stresses are based on net section. Sample size does not meet guideline requirements.
| Correlative Information for Figure 2.3.1.3.8(j) | ||||||||||||||||
|
Product Form: Rolled bar, 1.125 inch diameter, air melted Properties:
Specimen Details: Notched, V-Groove, Kt = 3.3 0.450 inch gross diameter 0.400 inch net diameter 0.010 inch root radius, r 60° flank angle, ω Surface Condition: Lathe turned to RMS 10 Reference: 2.3.1.3.8(b) |
Test Parameters: Loading - Axial Frequency - 2000 to 2500 cpm Temperature - 1000°F Atmosphere - Air No. of Heat/Lots: 1 Equivalent Stress Equation: Log Nf = 9.76-3.75 log (Seq-30.0) Seq = Smax (1-R)0.50 Std. Error of Estimate, Log (Life) = 0.40 Standard Deviation, Log (Life) = 1.22 R² = 89% Sample Size = 12 [Caution: The equivalent stress model may provide unrealistic life predictions for stress ratios beyond those represented above.] |
|||||||||||||||
.png)
Figure 2.3.1.3.8(k). Best-fit S/N curves for unnotched AISI 4340 alloy steel bar and die forging, Ftu = 200 ksi, longitudinal direction.
Kₜ = 1. Stresses are based on net section.
| Correlative Information for Figure 2.3.1.3.8(k) | ||||||||||
|
Product Form: Rolled bar, 1.125 inch diameter, air melted; Die forging (landing gear-B-36 aircraft), air melted Properties:
Specimen Details: Unnotched 0.300 and 0.400 inch diameter Surface Condition: Hand polished to RMS 5-10 References: 2.3.1.3.8(a) and (c) |
Test Parameters: Loading - Axial Frequency - 2000 to 2500 cpm Temperature - RT Atmosphere - Air No. of Heat/Lots: 2 Equivalent Stress Equation: Log Nf = 9.31-2.73 log (Seq-93.4) Seq = Smax (1-R)0.59 Std. Error of Estimate, Log (Life) = 0.49 Standard Deviation, Log (Life) = 0.93 R² = 72% Sample Size = 26 [Caution: The equivalent stress model may provide unrealistic life predictions for stress ratios beyond those represented above.] |
|||||||||
.png)
Figure 2.3.1.3.8(l). Best-fit S/N curves for notched, Kt = 3.3, AISI 4340 alloy steel bar, Ftu = 200 ksi, longitudinal direction.
Kₜ = 3.3. Stresses are based on net section.
| Correlative Information for Figure 2.3.1.3.8(l) | ||||||||||
|
Product Form: Rolled bar, 1.125 inch diameter, air melted Properties:
Specimen Details: Notched, V-Groove, Kt = 3.3 0.450 inch gross diameter 0.400 inch net diameter 0.010 inch root radius, r 60° flank angle, ω Surface Condition: Lathe turned to RMS 10 Reference: 2.3.1.3.8(a) |
Test Parameters: Loading - Axial Frequency - 2000 to 2500 cpm Temperature - RT Atmosphere - Air No. of Heat/Lots: 1 Equivalent Stress Equation: Log Nf = 7.52-1.96 log (Seq-31.2) Seq = Smax (1-R)0.65 Std. Error of Estimate, Log (Life) = 0.16 Standard Deviation, Log (Life) = 0.62 R² = 93% Sample Size = 26 [Caution: The equivalent stress model may provide unrealistic life predictions for stress ratios beyond those represented above.] |
|||||||||
.png)
Figure 2.3.1.3.8(m). Best-fit S/N curves for unnotched AISI 4340 alloy steel bar and billet, Ftu = 260 ksi, longitudinal direction.
Kₜ = 1. Stresses are based on net section.
| Correlative Information for Figure 2.3.1.3.8(m) | ||||||||||
|
Product Form: Rolled bar, 1.125 inch diameter, air melted; Billet, 6 inches RCS air melted Properties:
Specimen Details: Unnotched 0.200 and 0.400 inch diameter Surface Condition: Hand polished to RMS 10 References: 2.3.1.3.8(a) and (b) |
Test Parameters: Loading - Axial Frequency - 1800 to 2500 cpm Temperature - RT Atmosphere - Air No. of Heat/Lots: 2 Equivalent Stress Equation: Log Nf = 11.62-3.75 log (Seq-80.0) Seq = Smax (1-R)0.44 Std. Error of Estimate, Log (Life) = 0.64 Standard Deviation, Log (Life) = 0.86 R² = 45% Sample Size = 41 [Caution: The equivalent stress model may provide unrealistic life predictions for stress ratios beyond those represented above.] |
|||||||||
.png)
Figure 2.3.1.3.8(n). Best-fit S/N curves for notched, Kt = 2.0, AISI 4340 alloy steel bar, Ftu = 260 ksi, longitudinal direction.
Kₜ = 2. Stresses are based on net section.
| Correlative Information for Figure 2.3.1.3.8(n) | ||||||||||
|
Product Form: Rolled bar, 1.125 inch diameter, air melted Properties:
Specimen Details: Notched, V-Groove, Kt = 2.0 0.300 inch gross diameter 0.220 inch net diameter 0.030 inch root radius, r 60° flank angle, ω Surface Condition: Lathe turned to RMS 10 Reference: 2.3.1.3.8(a) |
Test Parameters: Loading - Axial Frequency - 2000 to 2500 cpm Temperature - RT Atmosphere - Air No. of Heat/Lots: 1 Equivalent Stress Equation: Log Nf = 9.46-2.65 log (Seq-50.0) Seq = Smax (1-R)0.64 Std. Error of Estimate, Log (Life) = 0.22 Standard Deviation, Log (Life) = 0.34 R² = 58% Sample Size = 30 [Caution: The equivalent stress model may provide unrealistic life predictions for stress ratios beyond those represented above.] |
|||||||||
.png)
Figure 2.3.1.3.8(o). Best-fit S/N curves for notched, Kt = 3.0, AISI 4340 alloy steel bar, Ftu = 260 ksi, longitudinal direction.
Kₜ = 3. Stresses are based on net section.
| Correlative Information for Figure 2.3.1.3.8(o) | ||||||||||
|
Product Form: Rolled bar, 1.125 inch diameter, air melted Properties:
Specimen Details: Notched, V-Groove, Kt = 3.0 0.270 inch gross diameter 0.220 inch net diameter 0.010 inch root radius, r 60° flank angle, ω Surface Condition: Lathe turned to RMS 10 Reference: 2.3.1.3.8(a) |
Test Parameters: Loading — Axial Frequency — 2000 to 2500 cpm Temperature — RT Atmosphere — Air No. of Heats/Lots: 1 Equivalent Stress Equation: Log Nf = 7.14-1.74 log (Seq - 56.4) Seq = Smax (1-R)0.51 Std. Error of Estimate, Log (Life) = 0.32 Standard Deviation, Log (Life) = 0.59 R² = 71% Sample Size = 29 [Caution: The equivalent stress model may provide unrealistic life predictions for stress ratios beyond those represented above.] |
|||||||||
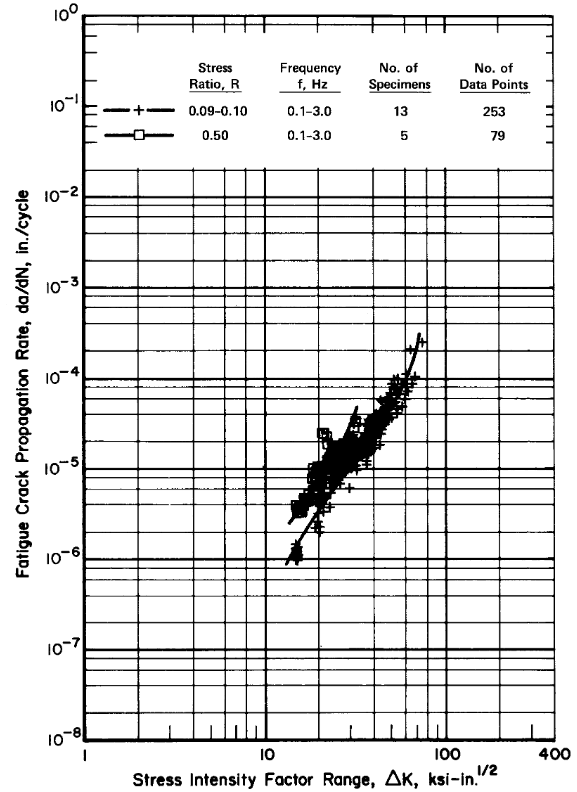
Best-fit S/N curves for 300M steel are presented in Figures 2.3.1.4.8(a) through (d). Fatigue-crack-propagation data for 300M are shown in Figure 2.3.1.4.9.
Figure 2.3.1.4.8(a). Best-fit S/N curves for unnotched 300M alloy forging, Ftu = 280 ksi, longitudinal and transverse directions.
Kₜ = 1.0. Stresses are based on net section.
| Correlative Information for Figure 2.3.1.4.8(a) | |||||||
|
Product Forms: Die forging, 10 × 20 inches CEVM; Die forging, 6.5 × 20 inches CEVM; RCS billet, 6 inches CEVM; Forged Bar, 1.25 × 8 inches CEVM Properties:
Specimen Details: Unnotched 0.200 - 0.250 inch diameter Surface Condition: Heat treat and finish grind to a surface finish of RMS 63 or better with light grinding parallel to specimen length, stress relieve References: 2.3.1.4.8(a), (c), (d), (e) |
Test Parameters: Loading - Axial Frequency - 1800 to 2000 cpm Temperature - RT Atmosphere - Air No. of Heat/Lots: 6 Equivalent Stress Equation: Log Nf = 14.8-5.38 log (Seq-63.8) Seq = Sa + 0.48 Sm Std. Error of Estimate, Log (Life) = 55.7 (1/Seq) Standard Deviation, Log (Life) = 1.037 R² = 82.0 Sample Size = 104 [Caution: The equivalent stress model may provide unrealistic life predictions for stress ratios beyond those represented above.] |
||||||
Figure 2.3.1.4.8(b). Best-fit S/N curves for notched, Kt = 2.0, 300M alloy forged billet, Ftu = 280 ksi, longitudinal direction.
Kₜ = 2. Stresses are based on net section.
| Correlative Information for Figure 2.3.1.4.8(b) | ||||||||||
|
Product Form: Forged billet, unspecified size, CEVM Properties:
Specimen Details: Notched, 60° V-Groove, Kt=2.0 0.500 inch gross diameter 0.250 inch net diameter 0.040 inch root radius, r 60° flank angle, ω Surface Condition: Heat treat and finish grind notch to RMS 63 ± 5; stress relieve Reference: 2.3.1.4.8(b) |
Test Parameters: Loading - Axial Frequency - Temperature - RT Atmosphere - Air No. of Heats/Lots: 3 Equivalent Stress Equation: Log Nf = 12.87-5.08 log (Seq-55.0) Seq = Smax (1-R)0.36 Std. Error of Estimate, Log (Life) = 0.79 Standard Deviation, Log (Life) = 1.72 R² = 79% Sample Size = 70 [Caution: The equivalent stress model may provide unrealistic life predictions for stress ratios beyond those represented above.] |
|||||||||
Figure 2.3.1.4.8(c). Best-fit S/N curves for notched, Kt = 3.0, 300M alloy forging, Ftu = 280 ksi, longitudinal and transverse directions.
Kₜ = 3. Stresses are based on net section.
| Correlative Information for Figure 2.3.1.4.8(c) | ||||||||||
|
Product Forms: Forged billet, unspecified size, CEVM; Die forging, 10 × 20 inches, CEVM; Die forging, 6.50 × 20 inches, CEVM Properties:
Specimen Details: Notched 60° V-Groove, Kt = 3.0 0.500 inch gross diameter 0.250 inch net diameter 0.0145 inch root radius, r 60° flank angle, ω Surface Condition: Heat treat and finish grind notch to RMS 63 or better; stress relieve References: 2.3.1.4.8(a), (b), (c) |
Test Parameters: Loading - Axial Frequency - Temperature - RT Atmosphere - Air No. of Heats/Lots: 5 Equivalent Stress Equation: Log Nf = 10.40-3.41 log (Seq-20.0) Seq = Smax (1-R)0.51 Std. Error of Estimate, Log (Life) = 18.3 (1/Seq) Standard Deviation, Log (Life) = 2.100 R² = 97.4 Sample Size = 99 [Caution: The equivalent stress model may provide unrealistic life predictions for stress ratios beyond those represented above.] |
|||||||||
Figure 2.3.1.4.8(d). Best-fit S/N curves for notched, Kt = 5.0, 300M alloy forged billet, Ftu = 280 ksi, longitudinal direction.
Kₜ = 5. Stresses are based on net section.
| Correlative Information for Figure 2.3.1.4.8(d) | ||||||||||
|
Product Forms: Forged billet, unspecified size, CEVM Properties:
Specimen Details: Notched, 60° V-Groove, Kt=5.0 0.500 inch gross diameter 0.250 inch net diameter 0.0042 inch root radius, r 60° flank angle, ω Surface Condition: Heat treat and finish grind notch to RMS 63 maximum; stress relieve Reference: 2.3.1.4.8(b) |
Test Parameters: Loading - Axial Frequency - Temperature - RT Atmosphere - Air No. of Heat/Lots: 2 Equivalent Stress Equation: Log Nf = 9.61-3.04 log (Seq-10.0) Seq = Smax (1-R)0.52 Std. Error of Estimate, Log (Life) = 0.28 Standard Deviation, Log (Life) = 0.81 R² = 88% Sample Size = 48 [Caution: The equivalent stress model may provide unrealistic life predictions for stress ratios beyond those represented above.] |
|||||||||
| Specimen Thickness: | 0.900-1.000 inches | Environment: | Low-humidity air |
| Specimen Width: | 3.09-7.41 inches | Temperature: | RT |
| Specimen Type: | CT | Orientation: | L-T and T-L |
Fatigue-crack-propagation data for D6AC steel are presented in Figure 2.3.1.5.9.
| Specimen Thickness: | 0.70-0.75 inch | Environment: | Dry air and lab air |
| Specimen Width: | 1.5-5.0 inches | Temperature: | RT |
| Specimen Type: | CT | Orientation: | L-T |
- 2.3.0.2.5“Heat Treating,” ASM Handbook, Volume 4, 1991.
- 2.3.1.3.8(a)Brodrick, R. F., and Rich, E. L., “Evaluation of the Fatigue Properties of SAE 4340, Thermold J, and Tricent Steel Under Axial Loading Conditions,” Technical Report No. 588/c39, Lessells and Associates (July 30, 1958).
- 2.3.1.3.8(b)Trapp, W. J., “Elevated Temperature Fatigue Properties of SAE 4340 Steel,” WADC TR 52-325, Part I (December 1952).
- 2.3.1.3.8(c)Oberg, T. T., and Ward, E. J., “Fatigue of Alloy Steels at High Stress Levels,” Wright Air Dev. Center TR 53-256 (October 1953).
- 2.3.1.3.8(d)Thrash, C. V., “Evaluation of High Strength Steels for Heavy Section Applications,” Douglas Aircraft Engineering TR No. LB-32437 (November 29, 1965).
- 2.3.1.4.8(a)Deel, O. L., and Mindlin, H., “Engineering Data on New and Emerging Structural Materials,” AFML-TR-70-252 (October 1970).
- 2.3.1.4.8(b)Bateh, E. J., “300M Steel Fatigue Program Structural Requirements,” Lockheed-Georgia Report No. 72-26-591 (January 5, 1967).
- 2.3.1.4.8(c)Harmsworth, C. L., “Low Cycle Fatigue Evaluation of Titanium 6Al-6V-2Sn and 300-M Steel for Landing Gear Applications,” AFML-TR-69-48 (June 1969).
- 2.3.1.4.8(d)Thrash, C. V., “Evaluation of High Strength Steels for DC-10,” Douglas Aircraft Company Report No. ETR-DAC-67520 (May 27, 1969).
- 2.3.1.4.8(e)Boswell, L. E., et al., “Fatigue Test for Landing Gear Material 300M Forgings,” Vought Corporation Report No. 70-59910-047 (May 22, 1970).
- 2.3.1.4.9(a)Dill, D. H., “Evaluation of Steel Alloys 300M, HP-9Ni-4Co-0.20, HP-9Ni-4Co-0.30, and PH13-8Mo,” Report MDC-A2639, McDonnell Aircraft Co. (December 21, 1973).
- 2.3.1.4.9(b)“B-1 Program da/dN Data for Steel Alloys,” Rockwell International Corp. (April 3, 1974).
- 2.3.1.5.9Feddersen, C. E., et al., “Crack Behavior in D6AC Steel,” Report MCIC 72-04, Battelle, Columbus, Ohio (January 1972).