Thermal Expansion Coefficient of Dry Air Calculator and Chart

Air Thermal Expansion Coefficient Chart

Canvas Element Not Working, Please Check Browser Settings or Contact KasperCalc to fix the issue.

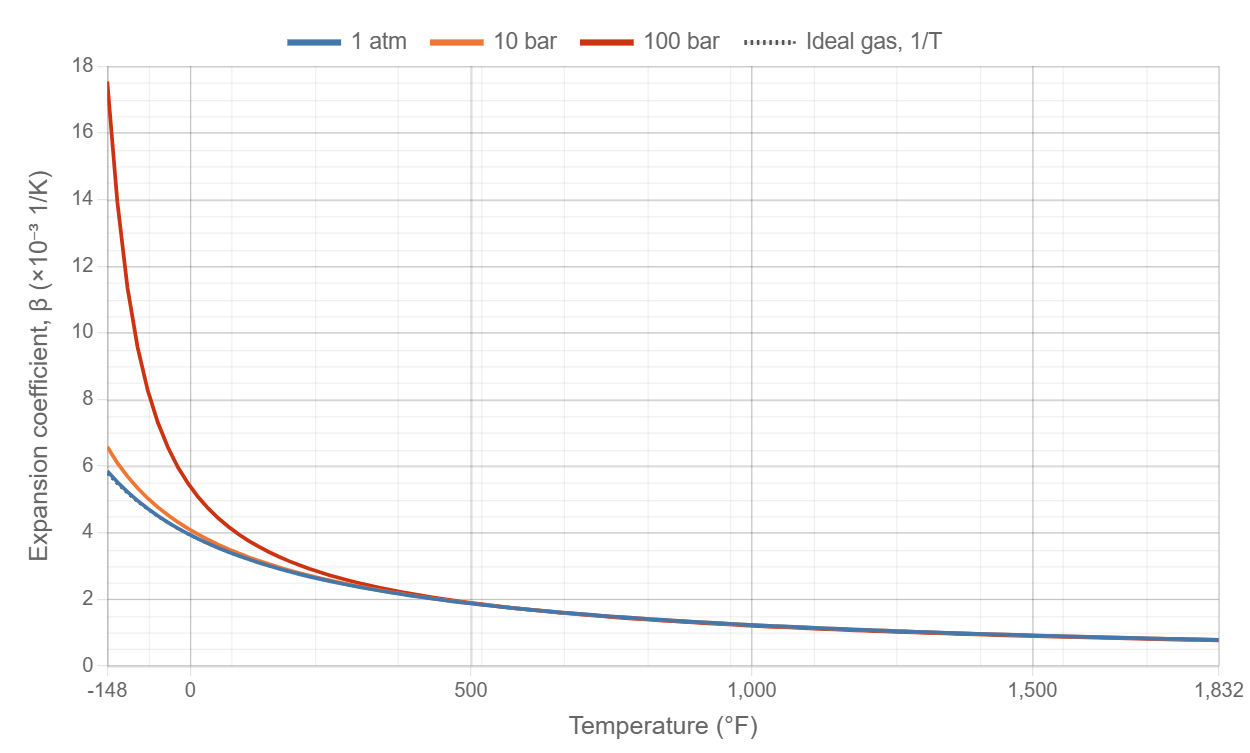
Thermal expansion coefficient beta of dry air vs temperature in degrees Fahrenheit at 1 atm, 10 bar and 100 bar, with the ideal gas value 1/T

Dry air, calculated with CoolProp 7.2.0 (isobaric expansion coefficient). The dotted line is the ideal gas value 1/T, which does not depend on pressure.

Air Thermal Expansion Coefficient Calculator
Degrees (°F):
Degrees (°C):
Pressure:
Real gas, β = (1/v)(∂v/∂T) at constant P
β (1/K):  
β ×10⁻₃ (1/K):  
β (1/°F):  
β ×10⁻₃ (1/°F):  
Ideal gas, β = 1/T
1/T ×10⁻₃ (1/K):  
Ideal minus real (% of real):  

Dry air, absolute pressure. Range: −100 to 1000 °C (−148 to 1832 °F) and 1 atm to 100 bar (14.696 to 1450 psia). Outside it the calculator shows “Out of Range”. Values are interpolated linearly in temperature (10 °C grid) and in ln P between 1 atm, 2, 5, 10, 20, 50 and 100 bar. Interpolation adds about 0.1 % at most (checked against CoolProp at six off-grid points).

Thermal Expansion Coefficient of Air
Quick answer

For dry air at 20 °C and 1 atm, β = 3.421×10⁻₃ 1/K (1.901×10⁻₃ 1/°F). The ideal gas value 1/T is 3.411×10⁻₃ 1/K, only -0.29 % different. This page is for dry air.

For most gas work at 1 atm, use β = 1/T with T in kelvin. The real-gas value matters at high pressure and low temperature.

What it is

β is the fractional change in volume per degree at constant pressure:

β = (1/v) (∂v/∂T)P = −(1/ρ) (∂ρ/∂T)P

For an ideal gas v = RT/P, so β = 1/T exactly. A hotter gas has a smaller β. β sets the buoyancy force in natural convection, through the Grashof and Rayleigh numbers:

Gr = g β ΔT L³ / ν²

At 100 bar and −100 °C the real β is 17.5×10⁻₃ 1/K, against 1/T = 5.78×10⁻₃ 1/K. Density comes from the air density page and ν from the viscosity page.

Where the numbers come from

Accuracy. Lemmon et al. (2000) state an uncertainty of about 0.1 % in density, 0.2 % in speed of sound and 1 % in heat capacity from the solidification point to 873 K (600 °C) and up to 70 MPa. Above 873 K there were no reliable air data, so nitrogen data were used and the paper gives about 0.5 % for density. Lemmon & Jacobsen (2004) state about 5 % for the viscosity and thermal conductivity of air, and more near the critical point. Viscosity and conductivity above about 600 °C, and the 1000 °C end of the range, are less certain than that. CoolProp uses a molar mass of 28.96546 g/mol, the U.S. Standard Atmosphere uses 28.9644 g/mol. That is the main reason CoolProp density at 15 °C and 1 atm is 0.04 % above the Standard Atmosphere value.

Dry Air Thermal Expansion Coefficient at 1 atm (101.325 kPa)

Volumetric expansion coefficient of dry air every 20 °C from −100 to 1000 °C at 1 atm.

Temp
(°C)
Temp
(°F)
β
(×10⁻₃ 1/K)
β
(×10⁻₃ 1/°F)
1/T ideal
(×10⁻₃ 1/K)
Ideal minus
real (%)
-100.0-148.05.85003.25005.7753-1.28
-80.00-112.05.22672.90375.1773-0.944
-60.00-76.004.72552.62534.6915-0.718
-40.00-40.004.31322.39624.2891-0.558
-20.00-4.0003.96772.20433.9502-0.441
032.003.67402.04113.6610-0.353
20.0068.003.42101.90053.4112-0.286
40.00104.03.20081.77823.1934-0.232
60.00140.03.00741.67083.0016-0.191
80.00176.02.83611.57562.8317-0.157
100.0212.02.68341.49082.6799-0.130
120.0248.02.54631.41462.5436-0.107
140.0284.02.42261.34592.4204-0.0883
160.0320.02.31041.28352.3087-0.0727
180.0356.02.20811.22672.2068-0.0602
200.0392.02.11451.17472.1135-0.0492
220.0428.02.02861.12702.0278-0.0394
240.0464.01.94941.08301.9487-0.0313
260.0500.01.87611.04231.8756-0.0245
280.0536.01.80821.00451.8078-0.0183
300.0572.01.74500.969431.7447-0.0138
320.0608.01.68610.936711.6859-0.00949
340.0644.01.63100.906121.6309-0.00552
360.0680.01.57940.877461.5794-0.00190
380.0716.01.53100.850571.53100.00131
400.0752.01.48550.825281.48550.00337
420.0788.01.44260.801441.44270.00624
440.0824.01.40210.778961.40220.00785
460.0860.01.36380.757691.36400.0103
480.0896.01.32760.737561.32780.0113
500.0932.01.29330.718471.29340.0124
520.0968.01.26060.700341.26080.0143
540.010041.22960.683111.22980.0155
560.010401.20010.666711.20030.0158
580.010761.17190.651071.17210.0171
600.011121.14510.636161.14530.0175
620.011481.11940.621911.11960.0179
640.011841.09490.608281.09510.0183
660.012201.07140.595241.07160.0187
680.012561.04900.582751.04920.0191
700.012921.02740.570771.02760.0195
720.013281.00670.559281.00690.0199
740.013640.986820.548230.987020.0203
760.014000.967720.537620.967910.0205
780.014360.949340.527410.949530.0205
800.014720.931640.517580.931840.0207
820.015080.914600.508110.914790.0209
840.015440.898160.498980.898350.0210
860.015800.882310.490170.882500.0211
880.016160.867010.481670.867190.0211
900.016520.852230.473460.852410.0211
920.016880.837940.465520.838120.0211
940.017240.824130.457850.824300.0211
960.017600.810760.450420.810930.0211
980.017960.797820.443230.797990.0211
100018320.785290.436270.785450.0210

Calculated with CoolProp 7.2.0.

Dry Air Thermal Expansion Coefficient at 1 atm, 10 bar and 100 bar

At selected temperatures and three pressures.

Temp
(°C)
Temp
(°F)
Pressure
(bara)
Pressure
(psia)
β
(×10⁻₃ 1/K)
β
(×10⁻₃ 1/°F)
1/T ideal
(×10⁻₃ 1/K)
Ideal minus
real (%)
1 bara (1 atm, 14.7 psia)
-100-148.01.01314.75.85003.25005.7753-1.28
032.001.01314.73.67402.04113.6610-0.353
100212.01.01314.72.68341.49082.6799-0.130
200392.01.01314.72.11451.17472.1135-0.0492
400752.01.01314.71.48550.825281.48550.00337
60011121.01314.71.14510.636161.14530.0175
80014721.01314.70.931640.517580.931840.0207
100018321.01314.70.785290.436270.785450.0210
10 bara (145 psia)
-100-148.0101456.57683.65385.7753-12.2
032.00101453.78802.10453.6610-3.35
100212.0101452.71321.50732.6799-1.23
200392.0101452.12321.17952.1135-0.457
400752.0101451.48490.824931.48550.0451
6001112101451.14330.635161.14530.174
8001472101450.929920.516620.931840.207
10001832101450.783820.435450.785450.209
100 bara (1450 psia)
-100-148.0100145017.5469.74775.7753-67.1
032.0010014504.72862.62703.6610-22.6
100212.010014502.91931.62182.6799-8.20
200392.010014502.17081.20602.1135-2.64
400752.010014501.46960.816431.48551.09
600111210014501.12260.623671.14532.02
800147210014500.911650.506470.931842.21
1000183210014500.768730.427070.785452.18

The calculator above covers 2, 5, 20 and 50 bar as well.

Sources
  • E. W. Lemmon, R. T. Jacobsen, S. G. Penoncello and D. G. Friend, “Thermodynamic Properties of Air and Mixtures of Nitrogen, Argon, and Oxygen From 60 to 2000 K at Pressures to 2000 MPa,” J. Phys. Chem. Ref. Data 29(3), 331–385, 2000. doi:10.1063/1.1285884. Equation of state for dry air: density, specific heats, speed of sound, compressibility factor. Opened the NIST reprint, accessed 25 Oct 2026.
  • E. W. Lemmon and R. T. Jacobsen, “Viscosity and Thermal Conductivity Equations for Nitrogen, Oxygen, Argon, and Air,” Int. J. Thermophys. 25(1), 21–69, 2004. doi:10.1023/B:IJOT.0000022327.04529.f3. Viscosity and thermal conductivity of air. Only the abstract was read (NIST publication page), accessed 25 Oct 2026.
  • I. H. Bell, J. Wronski, S. Quoilin and V. Lemort, “Pure and Pseudo-pure Fluid Thermophysical Property Evaluation and the Open-Source Thermophysical Property Library CoolProp,” Ind. Eng. Chem. Res. 53(6), 2498–2508, 2014. doi:10.1021/ie4033999. The software used (CoolProp 7.2.0, fluid “Air”) to evaluate the two correlations above.
  • NOAA, NASA and USAF, U.S. Standard Atmosphere, 1976, NASA-TM-X-74335. ntrs.nasa.gov/citations/19770009539. Sea-level reference values, dry-air composition and Sutherland constants, accessed 25 Oct 2026.

All numbers on this page are calculated, not measured here. See the Air General Properties page for the accuracy statements and the cross-check against the U.S. Standard Atmosphere.

Cite This Work