Thermal Conductivity of Dry Air Calculator and Chart

Air Thermal Conductivity Chart

Canvas Element Not Working, Please Check Browser Settings or Contact KasperCalc to fix the issue.

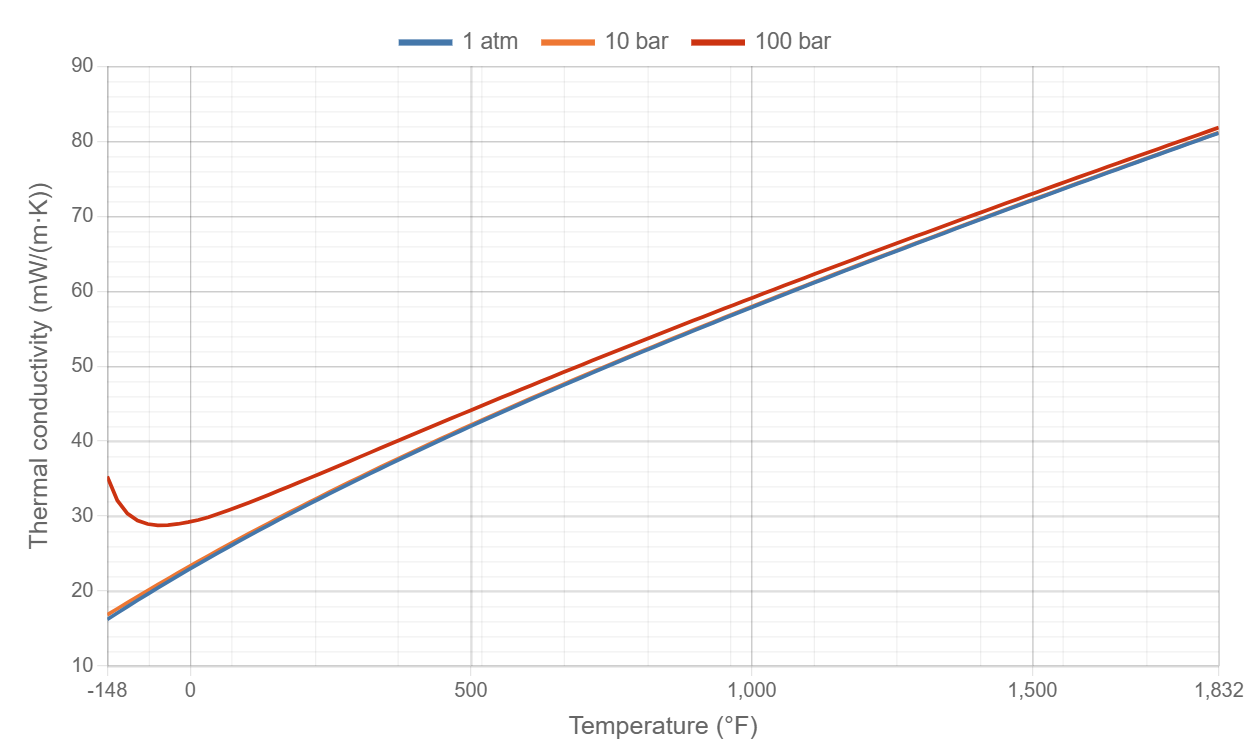
Thermal conductivity of dry air vs temperature in degrees Fahrenheit at 1 atm, 10 bar and 100 bar

Dry air, calculated with CoolProp 7.2.0 (Lemmon & Jacobsen 2004 conductivity equation). Uncertainty about 5 %. Above about 600 °C it is less certain.

Air Thermal Conductivity Calculator
Degrees (°F):
Degrees (°C):
Pressure:
Thermal conductivity
W/(m·K):  
mW/(m·K):  
Btu/(h·ft·°F):  
Btu·in/(h·ft²·°F):  
kcal/(h·m·°C):  

Dry air, absolute pressure. Range: −100 to 1000 °C (−148 to 1832 °F) and 1 atm to 100 bar (14.696 to 1450 psia). Outside it the calculator shows “Out of Range”. Values are interpolated linearly in temperature (10 °C grid) and in ln P between 1 atm, 2, 5, 10, 20, 50 and 100 bar. Interpolation adds about 0.1 % at most (checked against CoolProp at six off-grid points).

Thermal Conductivity of Air
Quick answer

Dry air at 20 °C and 1 atm conducts heat at 25.87 mW/(m·K), or 0.01495 Btu/(h·ft·°F). At 1000 °C it is 81.10 mW/(m·K). This page is for dry air.

Why it matters

Air is a good insulator because its conductivity is small, about 23 times lower than water. Still air in double glazing, foam and insulation blankets does most of the insulating. Moving air carries heat by convection. The heat transfer coefficient depends on conductivity, viscosity and specific heat through the Nusselt and Prandtl numbers.

Conductivity rises with temperature, because the gas molecules move faster. It changes very little with pressure up to about 10 bar. At 100 bar and low temperature it is higher, because the air is dense.

Where the numbers come from

Accuracy. Lemmon et al. (2000) state an uncertainty of about 0.1 % in density, 0.2 % in speed of sound and 1 % in heat capacity from the solidification point to 873 K (600 °C) and up to 70 MPa. Above 873 K there were no reliable air data, so nitrogen data were used and the paper gives about 0.5 % for density. Lemmon & Jacobsen (2004) state about 5 % for the viscosity and thermal conductivity of air, and more near the critical point. Viscosity and conductivity above about 600 °C, and the 1000 °C end of the range, are less certain than that. CoolProp uses a molar mass of 28.96546 g/mol, the U.S. Standard Atmosphere uses 28.9644 g/mol. That is the main reason CoolProp density at 15 °C and 1 atm is 0.04 % above the Standard Atmosphere value.

Dry Air Thermal Conductivity at 1 atm (101.325 kPa)

Thermal conductivity of dry air every 20 °C from −100 to 1000 °C at 1 atm.

Temp
(°C)
Temp
(°F)
k
(W/(m·K))
k
(mW/(m·K))
k
(Btu/(h·ft·°F))
k
(Btu·in/(h·ft²·°F))
-100.0-148.00.0162116.210.0093630.1124
-80.00-112.00.0179217.920.010360.1243
-60.00-76.000.0196019.600.011320.1359
-40.00-40.000.0212221.220.012260.1472
-20.00-4.0000.0228122.810.013180.1582
032.000.0243624.360.014080.1689
20.0068.000.0258725.870.014950.1794
40.00104.00.0273527.350.015810.1897
60.00140.00.0288028.800.016640.1997
80.00176.00.0302330.230.017460.2096
100.0212.00.0316231.620.018270.2192
120.0248.00.0329932.990.019060.2287
140.0284.00.0343434.340.019840.2381
160.0320.00.0356635.660.020600.2472
180.0356.00.0369636.960.021360.2563
200.0392.00.0382538.250.022100.2652
220.0428.00.0395139.510.022830.2740
240.0464.00.0407640.760.023550.2826
260.0500.00.0420042.000.024270.2912
280.0536.00.0432143.210.024970.2996
300.0572.00.0444244.420.025660.3080
320.0608.00.0456145.610.026350.3162
340.0644.00.0467846.780.027030.3244
360.0680.00.0479547.950.027700.3324
380.0716.00.0491049.100.028370.3404
400.0752.00.0502450.240.029030.3483
420.0788.00.0513751.370.029680.3562
440.0824.00.0524952.490.030330.3639
460.0860.00.0536053.600.030970.3716
480.0896.00.0547054.700.031610.3793
500.0932.00.0558055.800.032240.3869
520.0968.00.0568856.880.032860.3944
540.010040.0579657.960.033490.4018
560.010400.0590259.020.034100.4092
580.010760.0600860.080.034720.4166
600.011120.0611461.140.035330.4239
620.011480.0621962.190.035930.4312
640.011840.0632363.230.036530.4384
660.012200.0642664.260.037130.4456
680.012560.0652965.290.037720.4527
700.012920.0663166.310.038310.4598
720.013280.0673367.330.038900.4668
740.013640.0683468.340.039490.4738
760.014000.0693569.350.040070.4808
780.014360.0703570.350.040650.4878
800.014720.0713571.350.041220.4947
820.015080.0723472.340.041800.5016
840.015440.0733373.330.042370.5084
860.015800.0743174.310.042940.5153
880.016160.0752975.290.043500.5221
900.016520.0762776.270.044070.5288
920.016880.0772477.240.044630.5356
940.017240.0782178.210.045190.5423
960.017600.0791879.180.045750.5490
980.017960.0801480.140.046300.5556
100018320.0811081.100.046860.5623

Calculated with CoolProp 7.2.0.

Dry Air Thermal Conductivity at 1 atm, 10 bar and 100 bar

At selected temperatures and three pressures.

Temp
(°C)
Temp
(°F)
Pressure
(bara)
Pressure
(psia)
k
(W/(m·K))
k
(mW/(m·K))
k
(Btu/(h·ft·°F))
k
(Btu·in/(h·ft²·°F))
1 bara (1 atm, 14.7 psia)
-100-148.01.01314.70.0162116.210.0093630.1124
032.001.01314.70.0243624.360.014080.1689
100212.01.01314.70.0316231.620.018270.2192
200392.01.01314.70.0382538.250.022100.2652
400752.01.01314.70.0502450.240.029030.3483
60011121.01314.70.0611461.140.035330.4239
80014721.01314.70.0713571.350.041220.4947
100018321.01314.70.0811081.100.046860.5623
10 bara (145 psia)
-100-148.0101450.0168216.820.0097170.1166
032.00101450.0247024.700.014270.1712
100212.0101450.0318531.850.018400.2208
200392.0101450.0384238.420.022200.2664
400752.0101450.0503650.360.029100.3492
6001112101450.0612361.230.035380.4245
8001472101450.0714271.420.041260.4952
10001832101450.0811681.160.046890.5627
100 bara (1450 psia)
-100-148.010014500.0352935.290.020390.2447
032.0010014500.0298529.850.017240.2069
100212.010014500.0350635.060.020260.2431
200392.010014500.0407440.740.023540.2825
400752.010014500.0518251.820.029940.3593
600111210014500.0622862.280.035980.4318
800147210014500.0722372.230.041740.5008
1000183210014500.0818281.820.047270.5673

The calculator above covers 2, 5, 20 and 50 bar as well.

Sources
  • E. W. Lemmon, R. T. Jacobsen, S. G. Penoncello and D. G. Friend, “Thermodynamic Properties of Air and Mixtures of Nitrogen, Argon, and Oxygen From 60 to 2000 K at Pressures to 2000 MPa,” J. Phys. Chem. Ref. Data 29(3), 331–385, 2000. doi:10.1063/1.1285884. Equation of state for dry air: density, specific heats, speed of sound, compressibility factor. Opened the NIST reprint, accessed 25 Oct 2026.
  • E. W. Lemmon and R. T. Jacobsen, “Viscosity and Thermal Conductivity Equations for Nitrogen, Oxygen, Argon, and Air,” Int. J. Thermophys. 25(1), 21–69, 2004. doi:10.1023/B:IJOT.0000022327.04529.f3. Viscosity and thermal conductivity of air. Only the abstract was read (NIST publication page), accessed 25 Oct 2026.
  • I. H. Bell, J. Wronski, S. Quoilin and V. Lemort, “Pure and Pseudo-pure Fluid Thermophysical Property Evaluation and the Open-Source Thermophysical Property Library CoolProp,” Ind. Eng. Chem. Res. 53(6), 2498–2508, 2014. doi:10.1021/ie4033999. The software used (CoolProp 7.2.0, fluid “Air”) to evaluate the two correlations above.
  • NOAA, NASA and USAF, U.S. Standard Atmosphere, 1976, NASA-TM-X-74335. ntrs.nasa.gov/citations/19770009539. Sea-level reference values, dry-air composition and Sutherland constants, accessed 25 Oct 2026.

All numbers on this page are calculated, not measured here. See the Air General Properties page for the accuracy statements and the cross-check against the U.S. Standard Atmosphere.

Cite This Work