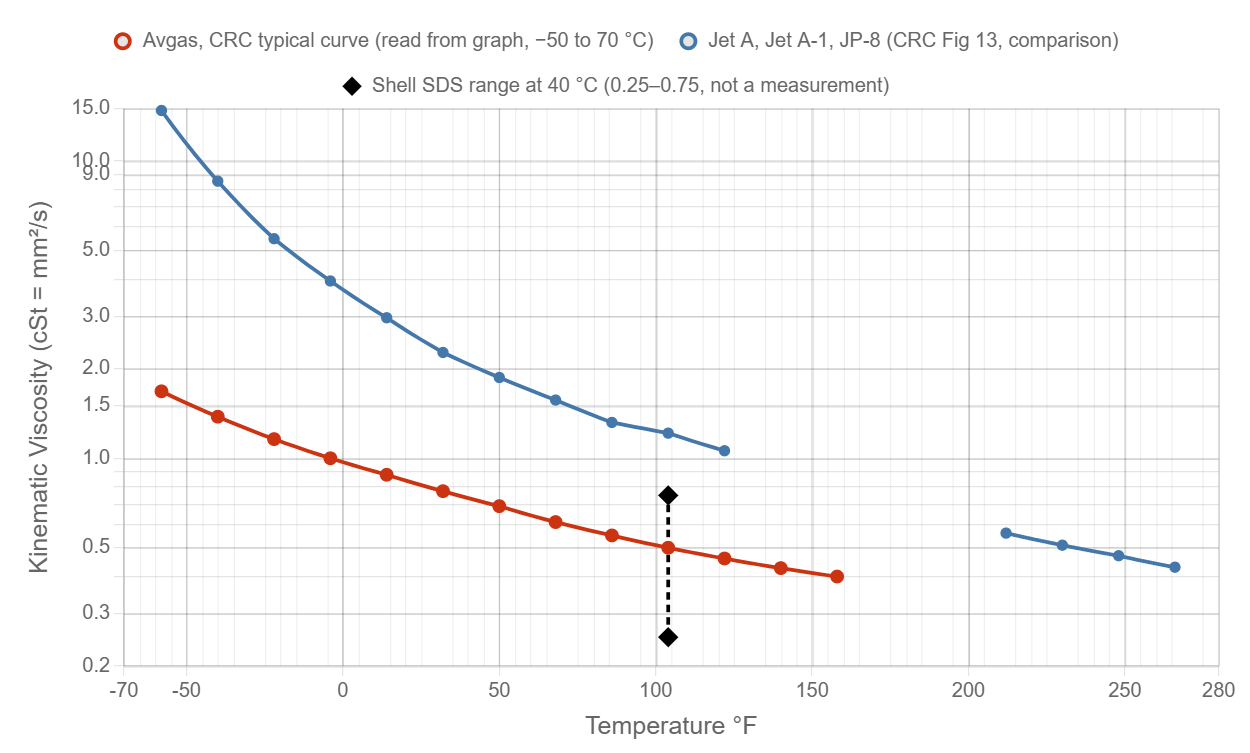
Avgas is very thin. Its kinematic viscosity is about 0.6 mm²/s at 20 °C (68 °F) and about 1.4 mm²/s at −40 °C. That is about two fifths of Jet A at the same temperature (1.6 mm²/s at 20 °C). The dynamic viscosity at 20 °C is about 0.43 mPa·s. Water is 1.0.
Red line: CRC Report 530 Fig 13, typical “Av Gas” curve, read from the graph (about ±4 %), −50 °C to 70 °C (−58 °F to 158 °F). The curve is an ASTM D341 interpolation through the read points. Y-axis is logarithmic.
Blue line: Jet A, Jet A-1 and JP-8 from the same CRC figure. We left out Jet A from 60 to 90 °C because the curve labels cover the line there, so the blue line has a gap. Circles are the points read from the graph.
Data from: CRC Report 530 (1983), DTIC ADA132106, Fig 13 (printed p.34). ASTM D910 sets no viscosity limit for avgas.
Toggle data sets by clicking the legend.
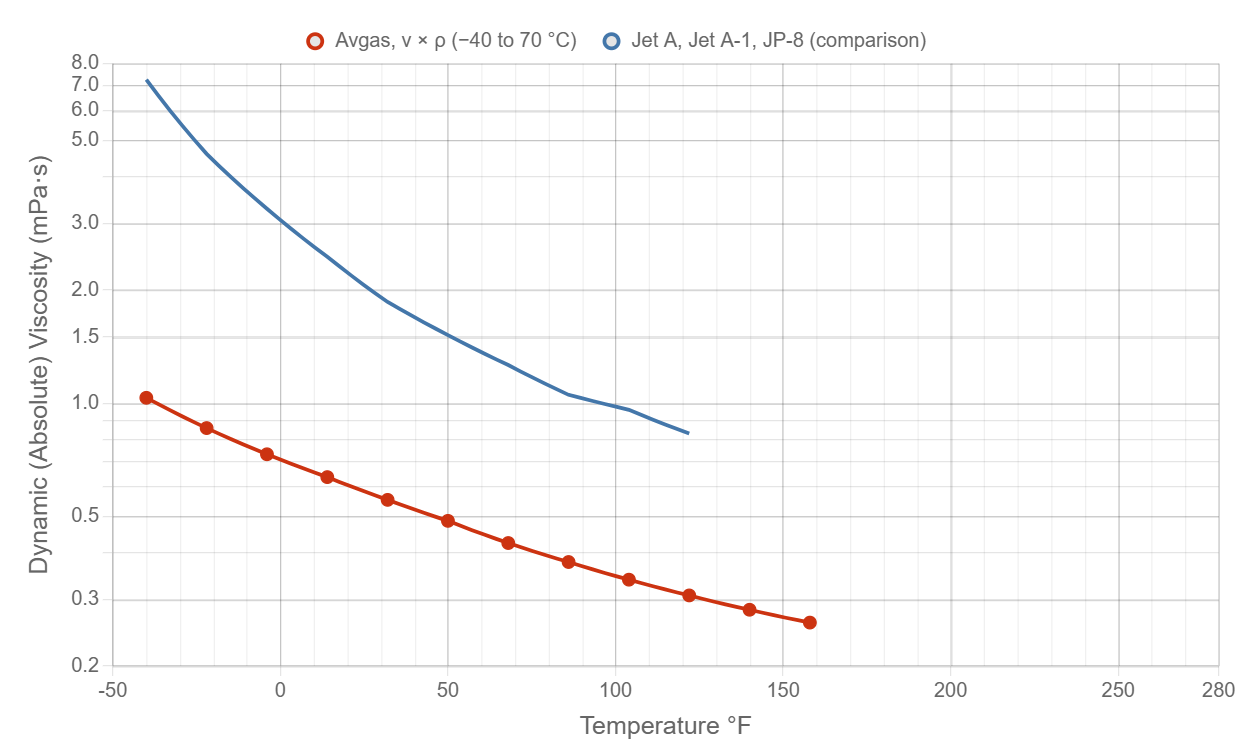
Computed from kinematic viscosity × density (μ = ν × ρ). Density comes from the CRC Report 530 Fig 3 fit (see avgas density), which starts at −40 °C, so the dynamic curve runs −40 °C to 70 °C (−40 °F to 158 °F). Y-axis is logarithmic.
Blue line: Jet A, same method with the Jet A density from CRC Fig 3. Gap at 60 to 90 °C as on the kinematic chart.
Toggle data sets by clicking the legend.
Kinematic viscosity is valid −50 °C to 70 °C (−58 °F to 158 °F), from the ASTM D341 interpolation through the points read from CRC Fig 13. Dynamic viscosity is shown from −40 °C to 70 °C, where the density fit exists. The Jet A rows are shown only where we could read the curve (−50 to 50 °C and 100 to 130 °C for kinematic; −40 to 50 °C and 100 to 130 °C for dynamic). This is a typical curve. Real batches differ.
The viscosity values are the “Av Gas” line in Fig 13 of CRC Report 530, Aviation Fuel Properties (Coordinating Research Council, 1983, DTIC ADA132106). It is a typical curve for aviation gasoline. It does not name a grade or batch. The chart is a standard ASTM D341 viscosity-temperature chart, so the line is nearly straight. We traced the line at 10 °C steps from a high-resolution image. The low-viscosity end (below 1 mm²/s) is hard to read on that scale, so we estimate ±4 % overall.
Between the read points the curve is a straight line in Y = log10(log10(ν + 0.7)) against X = log10(TK). Nothing is extrapolated. Avgas boils at atmospheric pressure above about 65 °C (its true vapor pressure reaches 1 atm there, see avgas vapor pressure). The hotter end of the curve applies only to fuel kept liquid under pressure.
Shell's safety data sheet for Avgas 100LL gives a kinematic viscosity of “typical 0.75 mm²/s” and a range of 0.25 to 0.75 mm²/s at 40 °C (method not stated). The CRC curve gives about 0.50 mm²/s at 40 °C, inside that range. We do not plot the Shell value, because it is a safety sheet range and not a measurement.
Dynamic viscosity (μ) is the fluid's resistance to shear. It is in mPa·s, the same number as centipoise. Kinematic viscosity (ν) is μ divided by density, in mm²/s, the same number as centistokes. Avgas is much less dense than oil, so its dynamic viscosity is a little lower than ν alone suggests: μ (mPa·s) = ν (mm²/s) × ρ (kg/m³) / 1000. See avgas density, avgas general properties, and the MIL-PRF-5606 hydraulic fluid page for a thick petroleum fluid.
| Temp (°C) | Temp (°F) | Avgas ν (mm²/s) | Avgas ρ (kg/m³) | Avgas μ (mPa·s) | Jet A ν (mm²/s) | Jet A μ (mPa·s) |
|---|---|---|---|---|---|---|
| -50 | -58.0 | 1.680 | — | — | 14.800 | — |
| -40 | -40.0 | 1.380 | 749.2 | 1.0339 | 8.560 | 7.257 |
| -30 | -22.0 | 1.160 | 740.4 | 0.8589 | 5.480 | 4.607 |
| -20 | -4.0 | 1.000 | 731.6 | 0.7316 | 3.950 | 3.292 |
| -10 | 14.0 | 0.880 | 722.8 | 0.6360 | 2.970 | 2.454 |
| 0 | 32.0 | 0.775 | 714.0 | 0.5533 | 2.270 | 1.859 |
| 10 | 50.0 | 0.690 | 705.1 | 0.4866 | 1.870 | 1.518 |
| 20 | 68.0 | 0.610 | 696.3 | 0.4248 | 1.570 | 1.264 |
| 30 | 86.0 | 0.550 | 687.5 | 0.3781 | 1.320 | 1.053 |
| 40 | 104.0 | 0.500 | 678.7 | 0.3394 | 1.215 | 0.960 |
| 50 | 122.0 | 0.460 | 669.9 | 0.3081 | 1.060 | 0.830 |
| 60 | 140.0 | 0.427 | 661.1 | 0.2823 | — | — |
| 70 | 158.0 | 0.400 | 652.3 | 0.2609 | — | — |
Avgas columns are interpolated from the CRC Fig 13 points below (read from graph, ±4 %). ρ is the CRC Fig 3 fit. μ = ν × ρ / 1000. Jet A columns use the Jet A / Jet A-1 / JP-8 line of the same figures. — means no data (outside the range, or the Jet A gap at 60 to 90 °C).
| Temp (°C) | Temp (°F) | Avgas ν read from graph (mm²/s) | Jet A ν read from graph (mm²/s) |
|---|---|---|---|
| -50 | -58.0 | 1.68 | 14.8 |
| -40 | -40.0 | 1.38 | 8.56 |
| -30 | -22.0 | 1.16 | 5.48 |
| -20 | -4.0 | 1.0 | 3.95 |
| -10 | 14.0 | 0.88 | 2.97 |
| 0 | 32.0 | 0.775 | 2.27 |
| 10 | 50.0 | 0.69 | 1.87 |
| 20 | 68.0 | 0.61 | 1.57 |
| 30 | 86.0 | 0.55 | 1.32 |
| 40 | 104.0 | 0.5 | 1.215 |
| 50 | 122.0 | 0.46 | 1.06 |
| 60 | 140.0 | 0.427 | — |
| 70 | 158.0 | 0.4 | — |
Read from the printed graph by tracing the line on a 3× render. Jet A points at 60 to 90 °C were not read because the labels cover the line.
- Coordinating Research Council, Aviation Fuel Properties (Handbook of Aviation Fuel Properties), CRC Report No. 530, 1983. DTIC ADA132106. apps.dtic.mil/sti/pdfs/ADA132106.pdf. Fig 13 (typical viscosity vs temperature for aircraft fuels, Av Gas and Jet A); Fig 3 (density) for the dynamic viscosity. Values read from the printed graph; accessed 25 Oct 2026.
- Shell Trading (US), Safety Data Sheet AVGAS 100LL, version 14.0, 6 Sep 2026. epc.shell.com. Kinematic viscosity typical 0.75 mm²/s, range 0.25 to 0.75 mm²/s at 40 °C (not plotted).
The CRC curve is a typical curve read from a printed graph, not a measurement made for this site. CRC does not state the method or uncertainty. Jet A at 60 to 90 °C was not read.