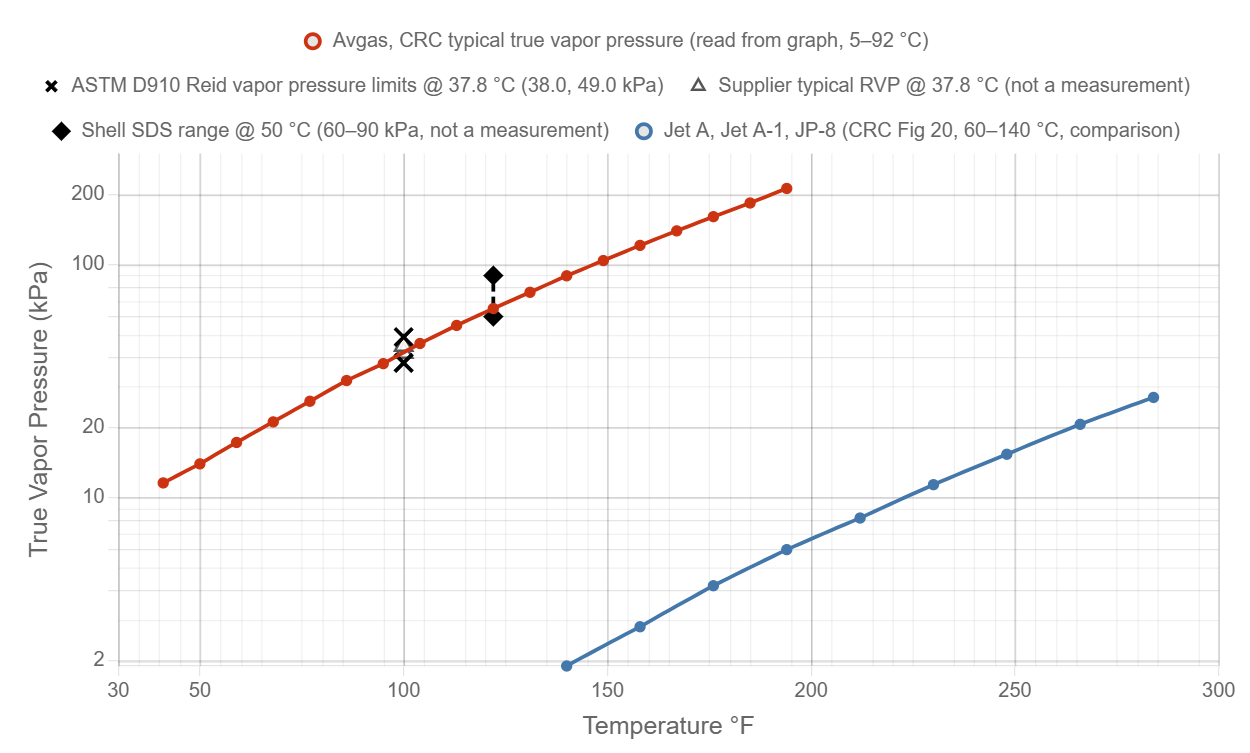
Avgas 100LL True Vapor Pressure vs. Temperature
| Temp (°C) | Temp (°F) | Avgas true vapor pressure (kPa) | Avgas (psia) | Jet A (kPa) | Jet A (psia) |
|---|
| 5 | 41.0 | 11.6 | 1.68 | — | — |
| 10 | 50.0 | 14.0 | 2.03 | — | — |
| 15 | 59.0 | 17.3 | 2.51 | — | — |
| 20 | 68.0 | 21.2 | 3.07 | — | — |
| 25 | 77.0 | 26.0 | 3.77 | — | — |
| 30 | 86.0 | 31.9 | 4.63 | — | — |
| 35 | 95.0 | 37.7 | 5.47 | — | — |
| 40 | 104.0 | 46.0 | 6.67 | — | — |
| 45 | 113.0 | 55.0 | 7.98 | — | — |
| 50 | 122.0 | 65.0 | 9.43 | — | — |
| 55 | 131.0 | 76.3 | 11.07 | — | — |
| 60 | 140.0 | 89.8 | 13.02 | 1.90 | 0.276 |
| 65 | 149.0 | 104.4 | 15.14 | 2.31 | 0.335 |
| 70 | 158.0 | 121.3 | 17.59 | 2.80 | 0.406 |
| 75 | 167.0 | 140.0 | 20.31 | 3.44 | 0.499 |
| 80 | 176.0 | 161.1 | 23.37 | 4.20 | 0.609 |
| 85 | 185.0 | 184.4 | 26.75 | 5.03 | 0.730 |
| 90 | 194.0 | 212.9 | 30.88 | 6.00 | 0.870 |
| 95 | 203.0 | — | — | 7.03 | 1.019 |
| 100 | 212.0 | — | — | 8.20 | 1.189 |
| 105 | 221.0 | — | — | 9.69 | 1.405 |
| 110 | 230.0 | — | — | 11.40 | 1.653 |
| 115 | 239.0 | — | — | 13.28 | 1.925 |
| 120 | 248.0 | — | — | 15.40 | 2.234 |
| 125 | 257.0 | — | — | 17.89 | 2.594 |
| 130 | 266.0 | — | — | 20.70 | 3.002 |
| 135 | 275.0 | — | — | 23.68 | 3.434 |
| 140 | 284.0 | — | — | 27.00 | 3.916 |
Interpolated from the CRC Fig 20 points below (read from graph, ±4 %), straight in ln P against 1/T between points. psia = kPa × 0.145038. — means the curve has no data there. These are true vapor pressures, not Reid values.
Points Read from CRC Report 530 Fig 20
| Temp (°C) | Temp (°F) | Avgas read from graph (kPa) | Jet A read from graph (kPa) |
|---|
| 5 | 41.0 | 11.6 | — |
| 10 | 50.0 | 14.0 | — |
| 15 | 59.0 | 17.3 | — |
| 20 | 68.0 | 21.2 | — |
| 25 | 77.0 | 26.0 | — |
| 30 | 86.0 | 31.9 | — |
| 35 | 95.0 | 37.7 | — |
| 40 | 104.0 | 46.0 | — |
| 45 | 113.0 | 55.0 | — |
| 50 | 122.0 | 65.0 | — |
| 55 | 131.0 | 76.3 | — |
| 60 | 140.0 | 89.8 | 1.9 |
| 65 | 149.0 | 104.4 | — |
| 70 | 158.0 | 121.3 | 2.8 |
| 75 | 167.0 | 140.0 | — |
| 80 | 176.0 | 161.1 | 4.2 |
| 85 | 185.0 | 184.4 | — |
| 90 | 194.0 | 212.9 | 6.0 |
| 100 | 212.0 | — | 8.2 |
| 110 | 230.0 | — | 11.4 |
| 120 | 248.0 | — | 15.4 |
| 130 | 266.0 | — | 20.7 |
| 140 | 284.0 | — | 27.0 |
Read from the printed graph by tracing the line on a 3× render. Jet A points at 50 °C and below are on the edge of the graph and were not used.
Where the Typical Curve Reaches Ambient Pressure
| Altitude (ft) | Ambient pressure (kPa) | Ambient (psia) | Temp where avgas TVP = ambient (°C) | (°F) |
|---|
| 0 | 101.3 | 14.70 | 64 | 147 |
| 5,000 | 84.3 | 12.23 | 58 | 136 |
| 8,000 | 75.3 | 10.92 | 55 | 130 |
| 10,000 | 69.7 | 10.11 | 52 | 126 |
| 12,000 | 64.4 | 9.35 | 50 | 122 |
| 14,000 | 59.5 | 8.63 | 47 | 117 |
Ambient pressure is from the U.S. Standard Atmosphere 1976 troposphere formula. The temperature is where the typical avgas curve above equals that pressure, found by interpolation. It is where the pure fuel would boil, not a vapor lock threshold. Real fuel systems vapor lock below these temperatures if pressure drops in the line. Your batch can differ by several degrees.
Specification Limits for Reid Vapor Pressure
| Source | Limit at 37.8 °C (100 °F) | Typical |
|---|
| ASTM D910 as printed by ExxonMobil, Eni, TOTAL | 38.0 min / 49.0 max kPa (5.5 to 7.0 psi) | — |
| CRC Report 530 Table 1 (1981 edition of D910) | 5.5 to 7.0 psi (38.5 to 49.0 kPa) | — |
| Z Energy TDS (2016) | — | 42 kPa (D323) |
| Viva Energy (2019) | — | 45 kPa (D5191) |
| Shell safety data sheet (2026) | 38 to 49 kPa at 38 °C; 60 to 90 kPa at 50 °C (method not stated) | — |
CRC Table 1 prints 5.5 to 7.0 psi with 38.5 kPa as the converted low limit. Current sheets print 38.0 kPa.