Specific Heat of Avgas 100LL

Avgas 100LL has a specific heat of about 2.2 kJ/(kg·K) (0.53 Btu/(lbm·°F)) at 20 °C, rising about 0.004 kJ/(kg·K) for every °C. It is higher than Jet A at the same temperature (Jet A is not on the CRC chart below about 35 °C). Water is 4.18.

Avgas 100LL Specific Heat Capacity Chart

Canvas Element Not Working, Please Check Browser Settings or Contact KasperCalc to fix the issue.

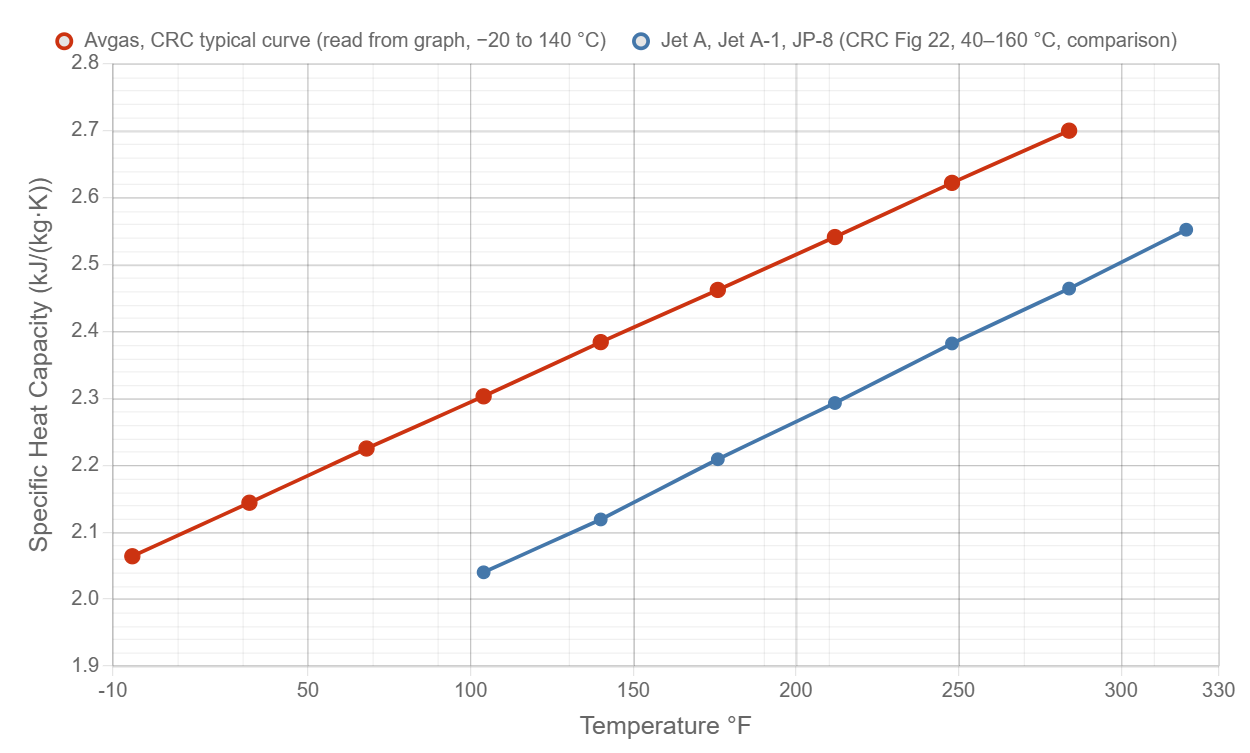
Avgas 100LL Specific Heat Capacity vs Temperature Graph

Red line: CRC Report 530 Fig 22, typical “Av Gas” specific heat, read from the graph (about ±0.015 kJ/(kg·K)), −20 °C to 140 °C (−4 °F to 284 °F). Circles are the points read. Blue line: Jet A, Jet A-1 and JP-8 from the same figure, 40 °C to 160 °C.

Above about 65 °C avgas boils at atmospheric pressure (see vapor pressure). The hotter part of the curve applies to fuel kept liquid under pressure.

Data from: CRC Report 530 (1983), DTIC ADA132106, Fig 22 (printed p.55).

Toggle data sets by clicking the legend.

Avgas 100LL Specific Heat Capacity Calculator
Degrees (°F):
Degrees (°C):
J / (kg·K):  
kJ / (kg·K):  
J / (g·K):  
kWh / (kg·K):  
Btu / (lbm·°F):  
cal / (g·°C):  
Jet A (J/(kg·K)):  

Calculator valid −20 °C to 140 °C (−4 °F to 284 °F), from straight lines between the points read from CRC Fig 22. The Jet A row is shown only inside the Jet A curve (40 °C to 160 °C). Typical values, not measurements of a given batch.

Specific Heat Capacity of Avgas 100LL
What Is Isobaric Specific Heat Capacity (Cp)?

Specific heat capacity (Cp) is the heat needed to raise one unit of mass by one degree at constant pressure. For avgas it is in J/(kg·K) [SI] or Btu/(lbm·°F) [US]. The heat flow into a stream of fuel is Q = ṁ · Cp · ΔT, where ṁ is the mass flow and ΔT the temperature change. Use the density page to turn gallons into pounds first.

About This Data

The curve is the “Av Gas” line in Fig 22 of CRC Report 530 (Coordinating Research Council, 1983, DTIC ADA132106). It is a typical curve. It does not name a grade or batch. CRC says the data come from differential scanning calorimeter tests and, for most of the points, from a correlation by J. B. Maxwell that uses average fuel gravity and distillation data. We read the line at 20 °C steps from a high-resolution image. The line is nearly straight: Cp ≈ 2.145 + 0.00397 · T°C kJ/(kg·K) over the range. CRC states no uncertainty for this figure.

Avgas 100LL Specific Heat vs. Temperature
Temp (°C)Temp (°F)Avgas Cp (J/(kg·K))Avgas Cp (kJ/(kg·K))Avgas Cp (Btu/(lbm·°F))Jet A Cp (J/(kg·K))Jet A Cp (kJ/(kg·K))
-20-4.020642.0640.4930——
-1014.021042.1040.5025——
032.021442.1440.5121——
1050.021842.1840.5218——
2068.022252.2250.5314——
3086.022642.2640.5407——
40104.023032.3030.550120402.040
50122.023432.3430.559720802.080
60140.023842.3840.569421192.119
70158.024232.4230.578721642.164
80176.024622.4620.588022092.209
90194.025022.5020.597522512.251
100212.025412.5410.606922932.293
110230.025822.5820.616623382.338
120248.026222.6220.626323822.382
130266.026612.6610.635624232.423
140284.027002.7000.644924642.464

Avgas values are straight-line interpolation between the CRC Fig 22 points (read from graph, ±0.015 kJ/(kg·K)). Btu/(lbm·°F) = kJ/(kg·K) / 4.1868. Jet A / Jet A-1 / JP-8 values are the same figure; — means the Jet A curve is not on the chart there.

Points Read from CRC Report 530 Fig 22
Temp (°C)Temp (°F)Avgas Cp read from graph (kJ/(kg·K))Jet A Cp read from graph (kJ/(kg·K))
-20-4.02.064—
032.02.144—
2068.02.225—
40104.02.3032.04
60140.02.3842.119
80176.02.4622.209
100212.02.5412.293
120248.02.6222.382
140284.02.72.464

Jet A points at 20 °C and below are off the bottom of the chart (the axis starts at 2.00). Where labels overlap the line, we took the line positions in order from the left edge.
Sources
  • Coordinating Research Council, Aviation Fuel Properties (Handbook of Aviation Fuel Properties), CRC Report No. 530, 1983. DTIC ADA132106. apps.dtic.mil/sti/pdfs/ADA132106.pdf. Fig 22 (typical specific heat vs temperature for aircraft fuels, Av Gas and Jet A); section 2.6.1. Values read from the printed graph; accessed 25 Oct 2026.

The CRC curve is a typical curve read from a printed graph, not a measurement made for this site. CRC gives no uncertainty for Fig 22.

Cite This Work